Advertisement
If you have a new account but are having problems posting or verifying your account, please email us on hello@boards.ie for help. Thanks :)
Hello all! Please ensure that you are posting a new thread or question in the appropriate forum. The Feedback forum is overwhelmed with questions that are having to be moved elsewhere. If you need help to verify your account contact hello@boards.ie
No Arctic Sea Ice in March 1959
Options
-
15-09-2009 2:26pm#1

And the video is here... http://www.accuweather.com/video-on-demand.asp?video=39454465001
Interesting.0
Comments
-
I ,ve posted my veiw on IWN.
I think more information and facts about our weather shouldnt be ignored anymore. This article above proves what many think, that the truth about our ever changing weather is surpressed and changed to suit vested interested parties.
The likes of the internet and news programmes, weather bulltins should be used to show the world or region cold hard facts about our climate.0 -
Ice at the North Pole in 1958 and 1959 – not so thick
26 04 2009
What would NSIDC and our media make of a photo like this if released by the NAVY today? Would we see headlines like “NORTH POLE NOW OPEN WATER”? Or maybe “Global warming melts North Pole”? Perhaps we would. sensationalism is all the rage these days. If it melts it makes headlines. Skate (SSN-578), surfaced at the North Pole, 17 March 1959. Image from NAVSOURCE
Some additional captures from the newsreel below show that the ice was pretty thin then, thin enough to assign deckhands to chip it off after surfacing.The newsreel is interesting, here is the transcript.1958 Newsreel: USS Skate, Nuclear Sub, Is First to Surface at North Pole
ED HERLIHY, reporting:
USS Skate heads north on another epic cruise into the strange underseas realm first opened up by our nuclear submarines. Last year, the Skate and her sister-sub Nautilus both cruised under the Arctic ice to the Pole. Then, conditions were most favorable. The Skate’s job is to see if it can be done when the Arctic winter is at its worst, with high winds pushing the floes into motion and the ice as thick as twenty-five feet.
Ten times she is able to surface. Once, at the North Pole, where crewmen performed a mission of sentiment, scattering the ashes of polar explorer Sir Hubert Wilkins. In 1931, he was the first to attempt a submarine cruise to the Pole. Now, the Skate’s twelve-day three thousand mile voyage under the ice, shown in Defense Department films, demonstrates that missile-carrying nuclear subs could lurk under the Polar Ice Cap, safe from attack, to emerge at will, and fire off H-bomb missiles to any target on Earth.
A powerful, retaliatory weapon for America’s defense. USS Skate during an Arctic surfacing in 1959. (US Navy Photo)
From John Daly:
For example, one crew member aboard the USS Skate which surfaced at the North Pole in 1959 and numerous other locations during Arctic cruises in 1958 and 1959 said:Here are some screencaps from the newsreel:“the Skate found open water both in the summer and following winter. We surfaced near the North Pole in the winter through thin ice less than 2 feet thick. The ice moves from Alaska to Iceland and the wind and tides causes open water as the ice breaks up. The Ice at the polar ice cap is an average of 6-8 feet thick, but with the wind and tides the ice will crack and open into large polynyas (areas of open water), these areas will refreeze over with thin ice. We had sonar equipment that would find these open or thin areas to come up through, thus limiting any damage to the submarine. The ice would also close in and cover these areas crushing together making large ice ridges both above and below the water. We came up through a very large opening in 1958 that was 1/2 mile long and 200 yards wide. The wind came up and closed the opening within 2 hours. On both trips we were able to find open water. We were not able to surface through ice thicker than 3 feet.”
- Hester, James E., Personal email communication, December 2000 Note the feet of the deckhand for thickness perspective
 Ice going over the side after chipping
It was that way again in 1962: Seadragon (SSN-584), foreground, and her sister Skate (SSN-578) during a rendezvous at the North Pole in August 1962
And of course then there’s this famous photo:
But contrast that to 1999, just 12 years later, lots of ice: USS Hawkbill at the North Pole, Spring 1999. (US Navy Photo)
But in 1993, it’s back to thin ice again: USS Pargo at the North Pole in 1993. (US Navy Photo)
The point illustrated here: the North Pole is not static, ice varies significantly. The Arctic is not static either. Variance is the norm.0 -
Moderators, Category Moderators, Computer Games Moderators, Society & Culture Moderators Posts: 8,503 CMod ✭✭✭✭
 Join Date:Posts: 8117
I guess this is sort of related: Pause in Arctic's melting trendThis summer's melt of Arctic sea ice has not been as profound as in the last two years, scientists said as the ice began its annual Autumn recovery.0 -
http://nsidc.org/sotc/sea_ice_animation.html
thought this might interest a lot of people. Just shows how varied the Artic is when it comes down to it!0 -
-
Advertisement
-
This is very interesting to think that there was no ice in 1959. They are scaremongering us as usual0
-
well according to whats up with that,the whole expedition was a farce,
The Top Ten Reasons why I think Catlin Arctic Ice Survey data can’t be trusted
15 10 2009
First, I loathe having to write another story about Pen Hadow and his Catlin Arctic Ice expedition, which I consider the scientific joke of 2009. But these opportunistic explorers are once again getting some press over the “science” data, and of course it is being used to make the usual alarmist pronouncements such as this badly written story in the BBC: Click for a larger image
WUWT followed the entire activist affair disguised as a science expedition from the start. You can see all of the coverage here. It’s not pretty. When I say this expedition was the “scientific joke of 2009″, I mean it.
On to the Top Ten List.
Top Ten Reasons why the Catlin Arctic Ice Survey data can’t be trusted
10.
High profile news and PR from the beginning, plus an unrealistic vision of self importance related to the mission. The entire venture was publicized well in advance of the actual expedition, and the mission was “too important to fail” according to the January 23rd interview with The Guardian Catlin team leader Pen Hadow said:“During this mammoth expedition we will gather the essential data that scientists need to more accurately determine when the permanent floating sea ice will disappear altogether. We cannot afford to fail on this mission – there is too much at stake.”With pronouncements like that, you also can’t afford not to bring home a result consistent with the theme of the expedition.
9.
Reality Show Science as reported here, “The trio will be sending in regular diary entries, videos and photographs to BBC News throughout their expedition.” When you tie science too closely to the media from the beginning, it predetermines some outcomes. That pressure is always there to produce the story rather than focus on the task. This is why most proper science is done well away from the media and the results are reported afterwards.
8.
Hadow, by his own admission, has an unrealistic and biased warmer view of the Arctic that doesn’t match the current data. In his Curriculum Vitae posted here, he writes:“Twenty years ago, you could walk to the North Pole – now you have to swim part of the way there.”Only problem is, the satellite data showed a completely different picture of solid ice, and Hadow’s expedition encountered temperatures of -44F (-42C) along the way, and the vast majority of the trip was below 32F (0C). He didn’t encounter vast leads of water along the way, and in fact encountered ice conditions far worse than he expected. This shows his bias for a warmer trip from the start.
7.
The Catlin team’s scientific advisor at the beginning of the trip seemed to already have a predetermined outcome for the Arctic. In this BBC article and interview they write of Professor Wieslaw Maslowski, a science advisor to the survey:“Ultimately, Professor Maslowski hopes to finesse his forecast for when the first ice-free summer might arrive.So if they already had this figured out from the beginning, why make the trip at all? Is it so the BBC could recycle the headline again today saying Arctic to be ‘ice-free in summer’? Why do “science” at great personal risk when you already are sure of the end game? There’s also another nugget of predisposition wisdom by Catlin’s science advisor Professor Maslowski. Read on.
Currently, he has it down for 2013 – but with an uncertainty range between 2010 and 2016.”
6.
They failed to advise of major equipment failure in a timely manner, inviting suspicion. The ice radar sounding equipment that was designed to do the thickness survey failed miserably, almost from day one, yet even though they were “sending in regular diary entries, videos and photographs to BBC News throughout their expedition,” the world didn’t learn of that failure until day 44 of the 73 day expedition. When Apollo 13 had a problem, the world knew about it almost immediately. When Catlin had a problem, it was covered up for well over a month, yet that didn’t stop the BBC from paraphrasing Apollo 13’s famous words for a headline ‘London, we have a problem’ as if there was some parallel in integrity and timeliness here.
5.
Hadow and his scientific advisor erroneously believed that their expedition was the only way ice thickness measurements could be done, and they seemed oblivious to other efforts and systems.
From this BBC article and interview:“No other information on ice thickness like this is expected to be made available to the scientific community in 2009,” explained Arctic ice modeller Professor Wieslaw Maslowski, a science advisor to the survey.While this was obviously a selling point to sponsors and an ego boost for the team, it was flat wrong. For example, there’s a bouy network that provides ice thickness data,. Then there’s ICEsat which provides mass and balance measurements, as well as ice thickness maps, shown below: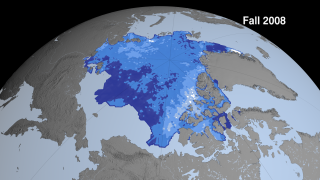

ICESat data for Fall 2008, source NASA Scientific Visualization Studio
As reported on WUWT, another data source of Arctic Ice thickness in 2009 came in the form of an aerial survey with a towed radar array from the Alfred Wegener Institute for Polar and Marine Research. They didn’t have to risk lives, create drama, or bleat constant headlines to the BBC while doing the science. They simply flew the plane over the ice a few times.
Here’s some excerpts of what was reported on WUWT in the story Inconvenient Eisdicken – “surprising results” from the ArcticAt the North Pole ice sheet is thicker than expectedGosh. Where’s the polar death defying drama in that?
The “Polar 5″ in Bremerhaven
The research aircraft Polar 5 “ended today in Canada’s recent Arctic expedition. During the flight, researchers have measured the current Eisstärke measured at the North Pole, and in areas that have never before been overflown. Result: The sea-ice in the surveyed areas is apparently thicker than the researchers had suspected.
Normally, ice is newly formed after two years, over two meters thick. “Here were Eisdicken up to four meters,” said a spokesman of Bremerhaven’s Alfred Wegener Institute for Polar and Marine Research. For scientists, this result is still in contradiction to the warming of the seawater.
4.
Due to the extreme cold conditions they were not fully prepared for, they completed less than half of the planned trip. Originally it was to be a 1000 kilometer trip to the North Pole which according to early interviews given by Hadow was easily done, yet they failed. The original start point was to be at 81N 130W but they actually started closer to the pole by about 100 kilometers.
Click here to explore the Catlin Arctic Survey in Google Earth (right click and save as)
According to the Google Earth KML file provided by Catlin, they started at 81.7N 129.7W and ended at 85.5N 125.6W for a total distance of approximately 435 kilometers over 73 days. Hardly a broad survey of the Arctic Ice when put into perspective on the Google Earth and ICEsat maps shown below: Catlin Route Map from GPS data with planned and actual start/end points
Here’s the Catlin Arctic Ice Survey Route overlaid on the ICEsat map. You can see just how little of the ice was actually surveyed. Catlin Arctic Survey Path over ICEsat map - click for larger image
Note that the ICEsat image is from Fall 2008, while the Catlin trip was in the Spring of 2009. Since we all know sea ice moves, often connected to the Beaufort Gyre, it is likely that the path depicted does not represent the ice Catlin actually traveled over. The sea ice may have moved so that the Catlin path traversed some of the thinner ice to the west, though some thickening of the ice would also be expected during the winter of 2009. The point of this map was to put the route in perspective.
3.
There’s very little actual data return for 73 days on the ice, only 39 datapoints. See the dataset they provide in the Excel file here: CAS Snow Ice Measurements – Final 2009
Final surveying results from the 2009 expedition.
The actual number of holes drilled and measured for ice thickness by Pen Hadow is said to be in the hundreds, and what we see in the Excel file is the average of those many holes at each drilling session. While I commend them for providing the raw hole data, problems with potential measurement bias don’t appear to be well addressed in the methodology paper they provide here (PDF) while it is mentioned in the preliminary June report:“One further consideration, when interpreting the ice thickness measurements made by the Catlin Arctic Survey team, may be navigational bias. Typically, the surface of First Year Ice floes are flatterthan that of multi‐year ice floes and because the team systematically seeks out flatter ice which is easier to travel over and camp on, there is a risk that the ice surveyed will not be representative.”Since they make no mention of the potential measurement bias in the final report, it appears that there wasn’t anything but lip service consideration given to it in the early report, possibly to appease critics.
2.
One of the most prominent sea ice researchers in the world, Dr. Walt Meier of NSIDC said he would not use the Catlin data saying in a post here on WUWT:“I don’t anticipate using the Catlin data.”That begs the question then, beyond the use of the data for generating news stories like we’ve seen in the BBC and other media outlets, who will? Even the media outlets have ignored the actual data Catlin made available, preferring sound bites over data bytes.
1.
The Catlin Arctic Ice Survey knowingly presented false data to the public and to the media in their web presentation.
As many WUWT readers recall, it was here that it was discovered that Catlin’s website had bogus telemetry data on it, giving the impression of “live data from the ice” when in fact the data repeated in an endless loop from a short period.
Here’s the story from WUWT
Catlin Arctic Survey website recycles biotelemetry data?Something quite odd is going on at the Catlin Arctic Survey website at: http://www.catlinarcticsurvey.com/When called out on the bogus telemetry data issue, the Catlin support team, rather than addressing the issue head on and with transparency, simply changed the web page for “live” telemetry to read “demonstrational”, and it remains that way today.
It appears that they are presenting recycled data from the biotelemetry sensors on the team. The “live from the ice” biotelemetry data for each team member is presented here:
http://www.catlinarcticsurvey.com/live_from_the_ice.aspx
Here is a screencap of what the biotelemetry section of that webpage looks like: click for full sized image
A WUWT commenter posted this:
karl heuer (07:40:46) :
The “Live from the Ice” biotelemetry is definitely not live:
When the data loads,
Pen Hadow core temp starts at 33.25 C every time the page loads, then increments up to 33.57, 33.64, 33.7, 33.75
every time, I have refreshed, cleared temp files and rebooted — still the same
WUWT commenter “hotrod” did his own check:
I just tried it looking at Pen Haddow’s pulse rate — Hmmm what are the odds that 32 consecutive pulse rate measurements would be identical?
Yes looks like the bio metric data is just white was to make their site look nifty, and has absolutely no value at all — perhaps they already have all their ice measurements in the can too?
This is what it originally showed:
Now it says:
Of course they could just end the farce and remove it. Because, well, who needs demonstrational biotelemetry anyway?
They also posted this at the bottom of the main page:An apologyThe real question is: how long would they have let that “live” impression go on had WUWT not called them on it? Originally the URL for the “biotelemetry” was
We’d like to apologise to anybody who felt misled by our recent biometric data. The data was initially displayed in error in a way that gave the impression that it was live. The intended qualification and explanation that it was, in fact, delayed information, was at first missing. We have subsequently corrected this with specific information concerning the above data. We apologise for the errors and to anyone who may have found the data misleading.
http://www.catlinarcticsurvey.com/live_from_the_ice.aspx
Now that URL if typed in your browser is automatically redirected to:
http://www.catlinarcticsurvey.com/latestfromtheice
So with the words “telemetry” and “live_from_the_ice.aspx” it is clear what the original intent was. The apology is about saving face, nothing else.
So the question to readers and media is: with these sorts of issues listed above, do you really want to trust the data from a group of people that perform and present “science” in this way? If you do, it would seem to me that you are putting form over substance. Even if we didn’t have these trust issues, are 39 datapoints over a short section of the Arctic really that useful given the other tools shown to be at the disposal of real science?
The Catlin Arctic Ice Survey is in my opinion, nothing more than a badly executed public relations stunt covered with the thinnest veneer of attempted science.
Update: On the morning of 10/15 I fixed about a half dozen typographical and grammatical errors in the essay. h/t to Harold Ambler and others for the tips on these. This included changing the description to “opportunistic explorers” in the first paragraph as in retrospect I felt my original description of was too harsh, since despite the shortcomings, omissions, and PR fluff, these people did a physical feat that few could do. My conclusion above remains unchanged by that fact though. – Anthony0


Advertisement