Advertisement
If you have a new account but are having problems posting or verifying your account, please email us on hello@boards.ie for help. Thanks :)
Hello all! Please ensure that you are posting a new thread or question in the appropriate forum. The Feedback forum is overwhelmed with questions that are having to be moved elsewhere. If you need help to verify your account contact hello@boards.ie

Climategate

Options
124

Comments

  • Posts: 31,118 ✭✭✭✭ [Deleted User]


    Will do up Belmullet's data into chart later on. Doland Baker, try adding a linear trend line into the graph, as it usual gives a fairly good indication of what what way data is heading.

    Good idea.. My excell skills are not that good! OK if I rtfm ;)


  • Posts: 31,118 ✭✭✭✭ [Deleted User]


    OK I've done a couple of trendlines one for the whole series and one for a 10 year average, I have also changed the vertical scale to make it easier to read.

    98438.jpg


  • Closed Accounts Posts: 5,150 ✭✭✭Deep Easterly


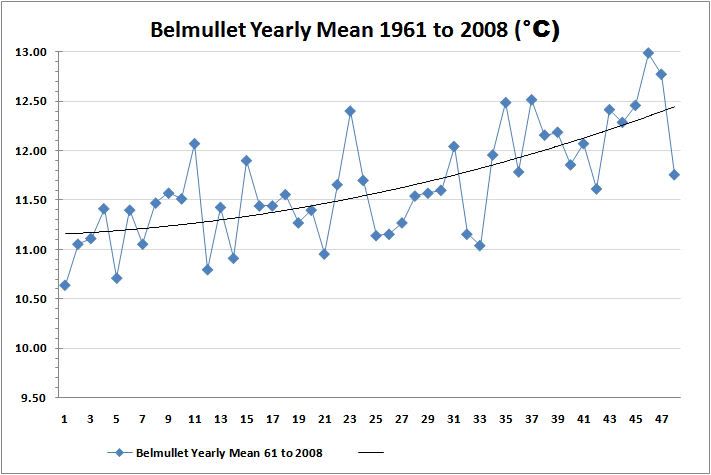
    Belmullet data only goes back to 1961, but here is a quick chart of yearly means for the station for the 61-08 period:

    Belmullet.jpg


  • Posts: 31,118 ✭✭✭✭ [Deleted User]


    Belmullet data only goes back to 1961, but here is a quick chart of yearly means for the station for the 61-08 period:

    Belmullet.jpg


    Just for comparative purposes I have done another chart for just 1961 - 2008

    98443.jpg


  • Closed Accounts Posts: 6,498 ✭✭✭Mothman


    Thanks,I've just downloaded the data, I have found dublin and did a quick squirt into excell, and ther appears to be no major changes over the 160 years of data, but it is clear that recent winters are less severe than those in the middle of the 20th century.

    If it is Dublin Airport then it is bad example to use because the station was moved fairly recently, I think the mid 90s. The new site is a colder site.

    Belmullet also has an issue that has I believe has compromised the site during recent years.

    Good work though DB and DE


  • Advertisement
  • Posts: 31,118 ✭✭✭✭ [Deleted User]


    Mothman wrote: »
    If it is Dublin Airport then it is bad example to use because the station was moved fairly recently, I think the mid 90s. The new site is a colder site.

    Belmullet also has an issue that has I believe has compromised the site during recent years.

    Good work though DB and DE
    Source file information
    Number= 039690
    Name= DUBLIN AIRPORT
    Country= IRELAND
    Lat= 53.4
    Long= 6.3
    Height= 68
    Start year= 1851
    End year= 2009
    First Good year= 1851
    Source ID= 30
    Source file= Jones+Anders
    Jones data to= 1991
    Normals source= Data
    Normals source start year= 1961
    Normals source end year= 1990
    Normals= 5.1 5.0 6.3 7.9 10.6 13.4 15.1 14.8 13.1 10.8 7.2 6.0
    Standard deviations source= Data
    Standard deviations source start year= 1941
    Standard deviations source end year= 1990
    Standard deviations= 1.5 1.6 1.3 1.0 0.9 0.9 0.9 1.0 0.9 1.2 1.0 1.3
    Obs:


  • Posts: 31,118 ✭✭✭✭ [Deleted User]


    OK I've repeated the exercise for Malin head.
    Number= 039800
    Name= MALIN HEAD
    Country= IRELAND
    Lat= 55.4
    Long= 7.3
    Height= 20
    Start year= 1890
    End year= 2009
    First Good year= 1890
    Source ID= 33
    Source file= Jones+Anders
    Jones data to= 2001
    Normals source= Data
    Normals source start year= 1961
    Normals source end year= 1990
    Normals= 5.4 5.2 6.3 7.7 10.0 12.4 13.9 14.1 12.8 10.8 7.6 6.4
    Standard deviations source= Data
    Standard deviations source start year= 1941
    Standard deviations source end year= 1990
    Standard deviations= 1.2 1.3 1.3 0.9 0.8 0.7 0.7 0.9 0.8 0.9 0.7 1.1
    Obs:
    98463.jpg

    This chart looks a lot scarier because it starts with a particurlary cool period and ends with a warm one.


  • Closed Accounts Posts: 6,498 ✭✭✭Mothman


    I have the Dublin AP file but don't know when I'll get to look at it. I am confused with regard what data is being used. When the climate station at Dublin AP opened escapes me at moment, but I think in the 40s, so where is the data from before then?

    And just to clarify re Belmullet, the issue I refer to was mentioned to me in passing and I can't share it here, but I think it may be quite a recent one (past 5 years) because I can't see anything vastly different when viewing the satellite photos from 1995,2000 & 2005.


  • Posts: 31,118 ✭✭✭✭ [Deleted User]


    Finally another chart with a longer timeline, Stockholn.

    Number= 024851
    Name= STOCKHOLM
    Country= SWEDEN
    Lat= 59.3
    Long= -18.1
    Height= 44
    Start year= 1756
    End year= 2009
    First Good year= 1756
    Source ID= 35
    Source file= Jones+Anders
    Jones data to= 2000
    Normals source= Data
    Normals source start year= 1961
    Normals source end year= 1990
    Normals= -3.6 -3.8 -0.8 3.7 9.4 14.5 16.2 15.5 11.5 7.3 2.1 -1.6
    Standard deviations source= Data
    Standard deviations source start year= 1941
    Standard deviations source end year= 1990
    Standard deviations= 3.2 3.6 2.5 1.5 1.4 1.4 1.5 1.5 1.3 1.2 1.6 2.1
    Obs:

    6034073


  • Posts: 31,118 ✭✭✭✭ [Deleted User]


    One thing I've noticed in all of the charts is the fact that the variations have increased in the final ten years or so, I wonder how much of this could be explained by the use of modern measuring methods as opposed to manual reading of mechanical instruments!

    Also note where all the source data came from!


  • Advertisement
  • Posts: 31,118 ✭✭✭✭ [Deleted User]


    Just for the craic, I have redone the Dublin charts just with the January and July Temperatures.

    98470.jpg

    It appears that the winters have become less cold rather than the summers getting warmer?


  • Posts: 0 [Deleted User]


    Any statisticians around? Seems to me like the deviation from the mean is as large in most cases, (but not all), and in some larger than the change from the start to the end. In my opinion either:

    A) the time frame is not long enough to be conclusive
    or
    B) the increase is within natural variation

    of course in combination with thousands of other weather stations around the world it might change things. Also bear in mind that Ireland is one of the places expected to be least effected by rising temperatures!


  • Posts: 31,118 ✭✭✭✭ [Deleted User]


    Also bear in mind that Ireland is on of the places expected to be least effected by rising temperatures!

    Yes that's true, the Atlantic is the prime driver of the weather here.

    Edit: OK here's one from De Bilt, in the Nederlands.

    98475.jpg

    And one for St Petersburg

    98478.jpg

    Plus one from Hobart Australia (note dodgy info around 1880)

    98480.jpg


  • Posts: 0 [Deleted User]


    still, overall changes are within the overall range even if you do not include the recent say 30/40years for the purpose of the range and yet include it for the trend!


  • Posts: 31,118 ✭✭✭✭ [Deleted User]


    still, overall changes are within the overall range even if you do not include the recent say 30/40years for the purpose of the range and yet include it for the trend!


    The only trend that is appearing, is that the winters are less severe, but as you say they are all small in comparison with the yearly variations that have been seen in the past.


  • Posts: 0 [Deleted User]


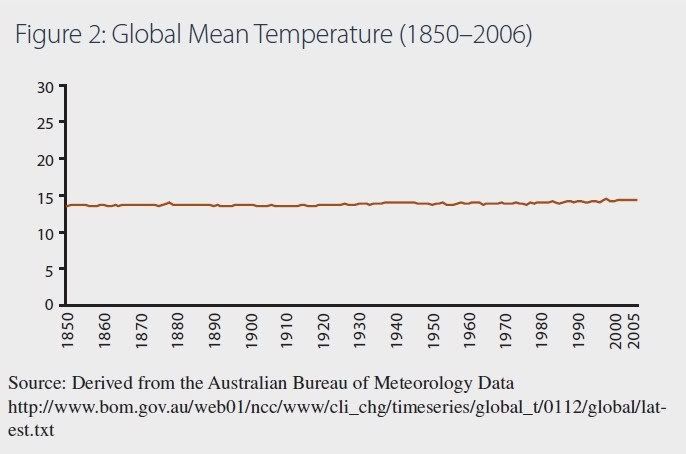
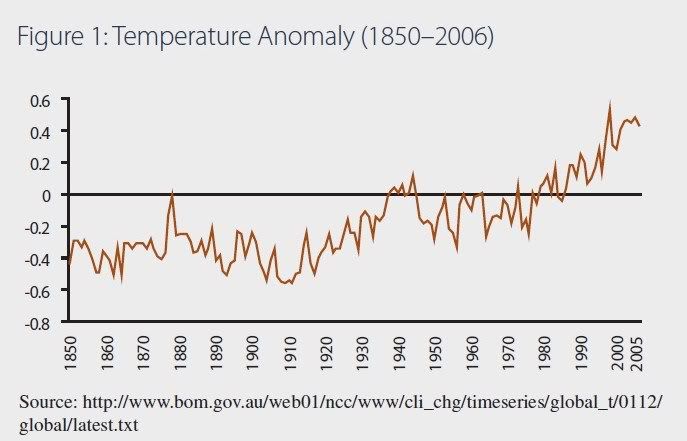
    What about different scales on the side

    for example:

    ipcctemps2.jpg

    and

    ipcctemps.jpg

    are both images showing the exact same trend and data, just the side scale is different


  • Posts: 0 [Deleted User]


    Meanwhile at Copenhagen:

    http://www.telegraph.co.uk/earth/copenhagen-climate-change-confe/6762640/Copenhagen-climate-summit-global-warming-caused-by-suns-radiation.html
    Global warming is caused by radiation from the sun, according to a leading scientist speaking out at an alternative "sceptics' conference" in Copenhagen.

    Professor Henrik Svensmark, a physicist at the Danish National Space Center in Copenhagen, said the recent warming period was caused by solar activity.

    He said the last time the world experienced such high temperatures, during the medieval warming period, the Sun and the Earth were in a similar cycle.

    Professor Nils-Axel Morner, a geologist from Stockholm University, said sea level rise has also been exaggerated by the “climate alarmists” using computer models.

    He said observational data from lake sediments, coast lines and trees show sea levels have remained stable.

    Professor Cliff Ollier, another geologist from the University of Western Australia, also said the environmental lobby have got it wrong on ice caps. He said the melting of ice sheets is caused by geothermal activity rather than global surface temperatures.

    Professor Ian Plimer, from the University of Adelaide, claimed carbon dioxide from volcanoes rather than humans is driving warming as part of a natural process.

    The meeting was organised by Danish group Climate Sense and the lobby group Committee for a Constructive Tomorrow (CFACT).

    Craig Rucker, Executive Director of CFACT, admitted the organisation have taken funding from Exxon Mobil in the past but pointed out that many environmental groups are also receiving funding from major corporations.


  • Closed Accounts Posts: 225 ✭✭e04bf099


    At the absolute minimum, we know that the science is not "out" and there are many many theories that are faaaaaaaaaaarrrrrrrrrr more probable than the current vomit coming out about links to carbon. The vomit might be correct, but it certainly isn't proven or definite, like we are led to believe by our idiot media and the manipulative politicians. I'm not talking conspiracy theories here. It is common knowledge and perfectly out in the open that they wish to give more power to the executive branches of governments around the world, after the success of China. Enda Kenny wants to get rid of the senate ffs, and he repeatedly discusses talking about making the executive branch of government more effficient. Thats what Lisbon was all about. And thats fine. There are many good reasons for doing this. I would fall on the side of a decent debate, and thats all. I don't have strong convictions either way.

    But using lies and deceit to buffer this project and damaging the credibility of scientific enquiry is pure madness! I would call these proponents of anthropogenic change insane on a level comparable to Europeans in the first 50 years of the 20th century.

    Not that all greens are insane. If you're a proponent of resourcism and new economic theories then fine. Thats a legitimate position. But if you believe in lying to the worlds population to get your ideology past the post then you are clearly stupid, naive and mad!


  • Closed Accounts Posts: 19 PatHawkins


    Did anyone know what happened to that "barbecue summer"?


  • Closed Accounts Posts: 19 PatHawkins


    I have a question,

    an "expert" was on the news the other day. He claimed that 8 of the ten warmest years every occured in the last decade.

    This is clearly outright lies, the BBC have even admitted that the world has cooled since 1998.

    This sham is quickly falling apart.


  • Advertisement
  • Registered Users Posts: 5,145 ✭✭✭nilhg


    PatHawkins wrote: »
    I have a question,

    an "expert" was on the news the other day. He claimed that 8 of the ten warmest years every occured in the last decade.

    This is clearly outright lies, the BBC have even admitted that the world has cooled since 1998.

    This sham is quickly falling apart.

    Well think about it, if 1998 was the warmest year on record, then by definition the world has cooled since, that doesn't preclude 8 of the ten warmest years having occured this decade.

    If you think it's lies fine just show us a link that demonstrates that.


  • Closed Accounts Posts: 3,185 ✭✭✭asdasd


    Lawson pointed out that it were as if population growth had stalled in the UK, but continued to fluctuate around but below the level in 1998. You could say that population had stalled, or you could say that 8 out of the last ten years had seen the biggest UK population ever.

    Or with the Irish economy? Recession? Nope 2008 and 2009 are in the top ten of GDP ever. It probably is that all of the top ten years for the Irish economy were in the last decade ( which is the case unless 2009 is less than 1999).

    And so on.

    True, but misleading.


  • Posts: 0 [Deleted User]


    nilhg wrote: »
    Well think about it, if 1998 was the warmest year on record, then by definition the world has cooled since, that doesn't preclude 8 of the ten warmest years having occured this decade.

    If you think it's lies fine just show us a link that demonstrates that.

    the hypothesis it that as CO2 ++ then Temp ++ , clearly it should be warmer in 2009 than is was in 1998 now that we are 11 years on for the hypothesis to hold true


  • Posts: 31,118 ✭✭✭✭ [Deleted User]


    asdasd wrote: »
    Lawson pointed out that it were as if population growth had stalled in the UK, but continued to fluctuate around but below the level in 1998. You could say that population had stalled, or you could say that 8 out of the last ten years had seen the biggest UK population ever.

    Or with the Irish economy? Recession? Nope 2008 and 2009 are in the top ten of GDP ever. It probably is that all of the top ten years for the Irish economy were in the last decade ( which is the case unless 2009 is less than 1999).

    And so on.

    True, but misleading.


    lol

    Good analogy!


  • Registered Users Posts: 5,145 ✭✭✭nilhg


    the hypothesis it that as CO2 ++ then Temp ++ , clearly it should be warmer in 2009 than is was in 1998 now that we are 11 years on for the hypothesis to hold true


    Yes in simple terms you would expect that, but we all know that the earth's climate is not a simple system.

    I'm just saying that despite the opinion expressed ,what the man on the news said is compatible with the truth, I'm not saying it's right (though I suspect it is) but it's not obviously wrong.


  • Posts: 0 [Deleted User]


    quadra.gif

    Interesting Data from Australia!
    Do we have similiar graphs?


  • Posts: 31,118 ✭✭✭✭ [Deleted User]


    quadra.gif

    Interesting Data from Australia!
    Do we have similiar graphs?


    Here is a link to some data from Armagh http://www.metoffice.gov.uk/climate/uk/stationdata/armaghdata.txt

    I may graph it later unless some else volunteers first ;)


  • Posts: 0 [Deleted User]


    http://www.met.ie/climate/climate-data-information.asp

    Most historical data held by Met Éireann are not available on this Web Site. A range of Climate data and products can be obtained by completing an Order Form or by contacting Climate Enquiries. There are charges for the supply of climate data.

    ^^ An absolute disgrace. Information collected using taxpayers money and they want to charge us for it. It should be open, free and importantly because they are carbon taxing us now the information should be transparent.

    :mad:


  • Posts: 31,118 ✭✭✭✭ [Deleted User]


    OK as promised here is the rainfall in Armagh chart, looks quite level to me...

    98745.jpg


  • Advertisement
  • Posts: 0 [Deleted User]


    Just an observation - over in the snow threads the computer models are only reliable a few days out. How can the climate models be anyway accurate!


Advertisement