Advertisement
If you have a new account but are having problems posting or verifying your account, please email us on hello@boards.ie for help. Thanks :)
Hello all! Please ensure that you are posting a new thread or question in the appropriate forum. The Feedback forum is overwhelmed with questions that are having to be moved elsewhere. If you need help to verify your account contact hello@boards.ie

Winter/Spring 2013 (Model Output Discussion)

Options
18788909293125

Comments

  • Registered Users Posts: 6,117 ✭✭✭Elmer Blooker


    derekon wrote: »
    Hey folks, lets put this into perspective. We always think its just Ireland that gets hits by the Atlantic but by this Friday, the UK, France, the Low Countries and Denmark will be overrun by the Atlantic muck - what British Weather Services are calling "the pest from the west" :D
    France yes but that ECM 144 chart I posted (if it actually happens) shows potential blizzard conditions for the North of England and Scotland.
    That's how much progress the front makes in three days from the time it arrives in SW England. To me that's blocking.
    The forecast after the news a minute ago indicated 4c on Friday with easterly winds- hardly a "rapid warm up"
    Having said all that the Atlantic will definitely win.


  • Registered Users Posts: 1,008 ✭✭✭icesnowfrost


    It's very depressing :(

    MOD NOTE

    MODEL /TECHNICAL DISCUSSION ONLY !!!!!!!!!!!!!!!!!!!!!!!!!!

    Its 'very depressing" does not fall into that category !


  • Closed Accounts Posts: 1,101 ✭✭✭Weathering


    Matt Hugo link. He's going for a cool unsettled outlook. Projected Jetstream
    Matthew Hugo ‏@MattHugo81
    With the jet stream heading into this position the synoptic outcome is cool, but particularly unsettled! pic.twitter.com/LuZpcjrI
    Hide photo Reply Retweeted Favorite


  • Registered Users Posts: 836 ✭✭✭derekon


    France yes but that ECM 144 chart I posted (if it actually happens) shows potential blizzard conditions for the North of England and Scotland.
    That's how much progress the front makes in three days from the time it arrives in SW England. To me that's blocking.
    The forecast after the news a minute ago indicated 4c on Friday with easterly winds- hardly a "rapid warm up"
    Having said all that the Atlantic will definitely win.

    I don't agree with you there Elmer.

    Just saw the latest BBC weather forecast (which is based on UK Met Office models) and the whole theme was based around the power of the Atlantic and how it would sweep through Britain from Thursday onward - the only mention of snow pertained to higher levels with the concern now for potential flooding and strong winds.

    It does not look like Britain will be getting much snow at lower levels.

    D


  • Registered Users Posts: 12,778 ✭✭✭✭ninebeanrows


    The 18z has been all over the place of late but the Regional pattern on the 18z isn't bad. Lots of good synoptics in there, we just need to piece them together so we can get our cold.

    The overall NH pattern could be a lot worse, to date we have just been unlucky.

    The next 5-7 days are going to be a write off but maybe we have some hope from day 7-14.


  • Advertisement
  • Registered Users Posts: 836 ✭✭✭derekon


    The 18z has been all over the place of late but the Regional pattern on the 18z isn't bad. Lots of good synoptics in there, we just need to piece them together so we can get our cold.

    The overall NH pattern could be a lot worse, to date we have just been unlucky.

    The next 5-7 days are going to be a write off but maybe we have some hope from day 7-14.

    Hi Weathercheck, what is your own view on this winter? Do you think we might have some hope of cold over the Christmas period?

    D


  • Site Banned Posts: 549 ✭✭✭Ares


    Hi guys, first time poster. I'm slowly education myself on the weather, mainly thanks to the great information and posters on this forum.

    I was wondering what would a chart like this entail;

    UW120-21.GIF?11-06

    Thanks guys.


  • Moderators, Home & Garden Moderators, Science, Health & Environment Moderators Posts: 17,922 Mod ✭✭✭✭DOCARCH


    Ares wrote: »
    Hi guys, first time poster. I'm slowly education myself on the weather, mainly thanks to the great information and posters on this forum.

    I was wondering what would a chart like this entail;

    Thanks guys.

    Wet, breezy (not too windy as isobars are fairly well spread out) and neither very mild/warm or very cold. The source of air is cold (from the NW Atlantic/off Greenland but then modified/warmed somewhat by travelling over warmer Atlantic waters.


  • Registered Users Posts: 6,117 ✭✭✭Elmer Blooker


    derekon wrote: »
    I don't agree with you there Elmer.

    Just saw the latest BBC weather forecast (which is based on UK Met Office models) and the whole theme was based around the power of the Atlantic and how it would sweep through Britain from Thursday onward - the only mention of snow pertained to higher levels with the concern now for potential flooding and strong winds.

    It does not look like Britain will be getting much snow at lower levels.

    D
    :o I don't even agree with myself at this stage! My post was before last night's fax charts which are usually very accurate - the Atlantic will push through effortlessly. But I'm certainly not writing off this winter yet, I still potential in this chart, the block is still there even if it is too far away to have an influence on our weather and the jet stream is so far south you'd think it was July! Exactly a year ago I wrote off winter 11/12 as a dead loss before it even started but not this year. (very similar to Dec '78)
    (some quite unusual readings in the Dublin area last night at 1am:
    airport +1c, Casement +2c, Phoenix Park -2c, my back yard +3c )

    FSXX00T_84.jpg


  • Registered Users Posts: 230 ✭✭oterra


    December 78


  • Advertisement
  • Registered Users Posts: 6,117 ✭✭✭Elmer Blooker


    very quiet around here, are things really that bad?
    a typical chart from that month (look familiar?) which went out with a bang as oterra's post shows.
    edit: I just remembered the 1st Jan '79 saw the lowest temperature of the 20th century in Ireland, -18.something in Kildare I think.

    http://www.wetterzentrale.de/pics/archive/ra/1978/Rrea00119781213.gif


  • Subscribers Posts: 8,322 ✭✭✭Scubadevils


    ...Exactly a year ago I wrote off winter 11/12 as a dead loss before it even started but not this year. (very similar to Dec '78)

    Yes I distinctly remember you saying that as I recall hating reading your posts as a result!


  • Registered Users Posts: 2,310 ✭✭✭Trogdor


    I don't remember ever seeing so much uncertainty in the ensembles just 24 hours away! A 5 degree spread in the range of possible 850hpa temperatures tonight..Fantasy Island at T+24?
    232415.png


  • Registered Users Posts: 1,008 ✭✭✭icesnowfrost


    Trogdor wrote: »
    I don't remember ever seeing so much uncertainty in the ensembles just 24 hours away! A 5 degree spread in the range of possible 850hpa temperatures tonight..Fantasy Island at T+24?
    232415.png

    Wat does that mean


  • Banned (with Prison Access) Posts: 25,234 ✭✭✭✭Sponge Bob


    Maybe it will precipitate and maybe it will not precipitate, in Dublin, today.


  • Registered Users Posts: 2,310 ✭✭✭Trogdor


    Wat does that mean

    Basically I'd have very low confidence in any forecasts produced by the models at the minute, even at short range


  • Registered Users Posts: 3,157 ✭✭✭Rebelbrowser


    Trogdor wrote: »
    I don't remember ever seeing so much uncertainty in the ensembles just 24 hours away! A 5 degree spread in the range of possible 850hpa temperatures tonight..Fantasy Island at T+24?
    232415.png

    Going on that the GFS for 25 Dec (and the lead in) is a real mild outlier, isn't it?


  • Registered Users Posts: 24,045 ✭✭✭✭Larbre34


    I think we can have high confidence that the next 3 weeks in Ireland will be a degree or 2 below average, damp, breezy at times, with any reckonable wintry falls confined to the very highest peaks. In other words, incredibly average.


  • Moderators, Technology & Internet Moderators Posts: 17,133 Mod ✭✭✭✭cherryghost


    Nothing but muck on the latest GFS run


  • Registered Users Posts: 629 ✭✭✭PurpleSt4in


    Trogdor wrote: »
    Basically I'd have very low confidence in any forecasts produced by the models at the minute, even at short range

    would you standy by the forecasts of people saying that milder weather is approaching?

    p.s. THATCHED ROOF COTTAGES


  • Advertisement
  • Registered Users Posts: 2,310 ✭✭✭Trogdor


    would you standy by the forecasts of people saying that milder weather is approaching?

    p.s. THATCHED ROOF COTTAGES

    Well at least the next few days do look like they will be a bit milder alright (especially at night) there's just a fair bit of uncertainty in the details at the moment, I don't see anything exceptionally mild in the next few days though (max temperatures maybe up to 9/10C)
    Going on that the GFS for 25 Dec (and the lead in) is a real mild outlier, isn't it?

    It was indeed, but anything that far out is pretty useless anyway


  • Registered Users Posts: 2,855 ✭✭✭Nabber


    At 27hrs. Good night and God bless :eek: To all those affected by this :P

    12121315_1212.gif


  • Banned (with Prison Access) Posts: 25,234 ✭✭✭✭Sponge Bob


    ECM has a near Bomb offshore within the next day and a bit. Far different to the slack gradients we had till earlier.

    ECM 12z showing 12z THURSDAY at 980

    ECM1-0.GIF?12-0

    ECM 12z showing 12z FRIDAY at 960

    ECM1-24.GIF?12-0
    l
    Problem is it starts to fill in thereafter ...ie by Saturday in the ECM but UKMO 'unbombs it less enthusiastically. Either way, windier than earlier forecasts.

    UW60-21.GIF?12-18


  • Closed Accounts Posts: 1,101 ✭✭✭Weathering


    The metoffice issued a wind warning for shetland earlier today warning of gusts in the regions of 80mph
    Where in Ireland would be most at risk of high winds/what gusts could we see?
    Thanks in advance


  • Registered Users Posts: 836 ✭✭✭derekon


    Well if we go by what this German meteorologist is saying, then this winter will be a write off in terms of snow. He states that December will be the coolest month with January and February reverting to wet, windy and mild weather, particularly over Northern Europe and Scandinavia.

    He added that "no major cold episodes are likely".
    Quite depressing for all the snow lovers out there :(

    D

    http://uk.weather.com/partners-winter/mild


  • Closed Accounts Posts: 4,791 ✭✭✭JJJJNR


    an all I can see is blue = cold, snow etc


  • Closed Accounts Posts: 1,101 ✭✭✭Weathering


    Yeah Derek,loads of those "types" of weather forecasters said December would be severely cold here and that didn't materialise thus far anyway. Don't take any heed of of predictions for January and February. This day last week most reliant weather forecasters and the majority of models pointing at snow for now so you can't be disheartened by what he said in regards to Jan and Feb


  • Registered Users Posts: 1,789 ✭✭✭BEASTERLY


    JJJJNR wrote: »
    an all I can see is blue = cold, snow etc

    The colour on the charts above do not represent temperature.


  • Registered Users Posts: 7,238 ✭✭✭Deank


    BEASTERLY wrote: »

    The colour on the charts above do not represent temperature.
    Beasterly maybe you should explain what the blue actually means to the novices here, from my limited understanding of the charts the differences in colour represent pressure. I stand to be corrected.


  • Advertisement
  • Moderators, Science, Health & Environment Moderators Posts: 7,146 Mod ✭✭✭✭pistolpetes11


    BEASTERLY wrote: »
    The colour on the charts above do not represent temperature.

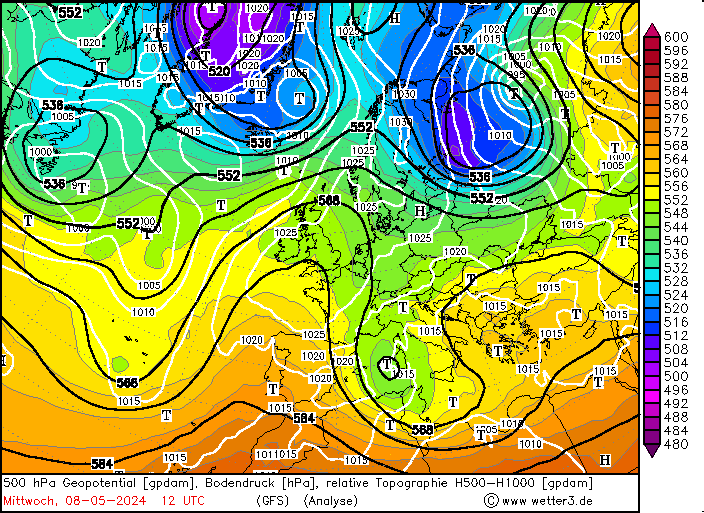
    An important chart is the 500 - 1000 hPa thickness chart, which shows the thickness of the layer of atmosphere between the 1000 and 500 hPa pressure levels. As described above, the colder the airmass, the denser the air, and hence the closer these two levels will be. For snow in Ireland, usually we need somewhere around 528 dm or lower, as this will ensure that the airmass is probably cold enough at all levels for snow to survive the descent to the surface,

    Of course, we need to also factor in conditions at the surface, which at the moment are not forecasted to be good for cold and snowy weather,


    http://www.boards.ie/vbulletin/newreply.php?do=newreply&p=75404833


    Su Campu wrote: »
    For the newer members on here, it might be a good idea to give a brief guide to what to look for on the charts as we head into wintertime - a time when many boardsies come back to the feeding ground after 8 months wandering the plains. As people jostle for position around the trough (pun intended!), tempers can flare up, and some can get chased way, back to other grounds in such places as Coleraine.....

    Firstly, there are several computer forecast models run by various agencies throughout the world. These models take in observational data from surface stations, ships, buoys, weather balloons, satellite and other sources, and run complex physical equations to determine the state of the atmosphere at various intervals into the future. Some models only deal with a limited area of the globe for a couple of days into the future (eg. HiRLAM (European Hi-Res Limited Area Model, NAE, RUC, etc), while other global models deal with the whole globe, for periods of several days to over two weeks (eg. ECMWF (European), GFS (USA), UK Met, GEM (Canadian), BOM (Australian), JMA (Japanese), etc.

    Different models have different amounts of freely-available data to the public (eg. ECMWF - widely regarded as the best overall perfomer, run twice a day, but few freely-available data), while others have more. The GFS has the best array of data available, on a wide number of atmospheric variables, and is hence one of the more popular ones used on places like boards. It also runs four times a day, out to 384 hours (16 days), and so it the one used in the Fantasy Island thread.....

    Here is one good source of models most people here use.....
    http://www.meteociel.com/modeles/ukmo2.php?carte=1021&ech=6&archive=0


    When determining the potential for cold weather, there are some key variables to look at. The first is the "upper chart" (500 or 300 hPa), which gives an outline of the broad global pattern of upper waves in the jet stream (at around 5.5 km and 9 km, respectively). As pressure falls with height, each pressure will be found at a certain height (geopotential) as you go up in the atmosphere. In general, the main "pressure levels" are 1000 hPa (near gound level), 850 hPa (around 1450 m), 700 hPa (around 3 km), 500 hPa (around 5.5 km) and 300 hPa (around 9 km). The exact height of these pressure levels (geopotential) is a function of the temperature of the atmosphere at that time - the warmer the atmosphere, the higher the pressure level will be, as warm air is less dense than cold air.

    An area of low geopotential corresponds to a cool airmass and is called a trough or depression, while and area of high geopotential corresponds to warmer airmass and is called a ridge or high. These areas of low and high geopotential form the familiar Rossby wave pattern in the atmospheric circulation around the globe. These upper features are a driving force for systems at lower levels, including surface storms, fronts, etc.

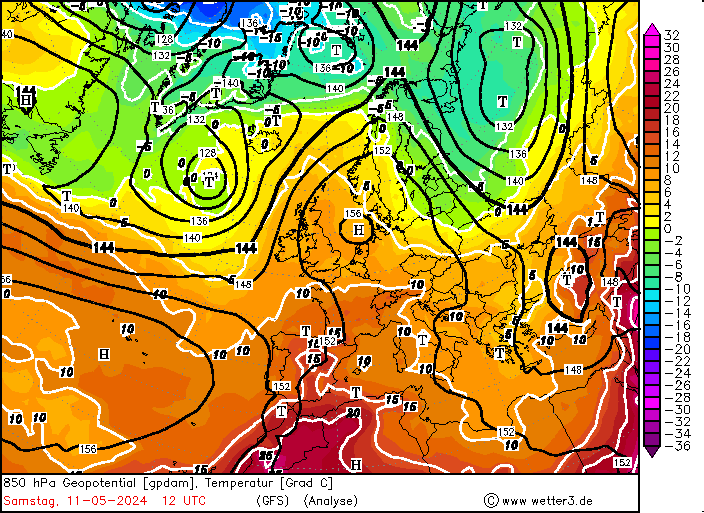
    Linked to these pressure levels are corresponding temperatures. Cold upper temperatures makes the atmosphere unstable, meaning warmer, less dense, air from below finds it easier to rise to great heights, forming showers and thunderstorms. Warmer air at upper levels puts a "cap" on such convection, and usually leads to more stable weather, with layered clouds. For snow lovers, a favourite chart is the 850 hPa one, which gives geopotential (in decameters, dm) and temperature of that level. To get snow at sea level, we generally look for 850 hPa temperatures (T850) of at least -8 °C, but it can still snow at -4 °C if conditions are right in the lowest layer of the atmophere (boundary layer).

    00_25.gif

    Another important chart is the 500 - 1000 hPa thickness chart, which shows the thickness of the layer of atmosphere between the 1000 and 500 hPa pressure levels. As described above, the colder the airmass, the denser the air, and hence the closer these two levels will be. For snow in Ireland, usually we need somewhere around 528 dm or lower, as this will ensure that the airmass is probably cold enough at all levels for snow to survive the descent to the surface.

    00_1.gif

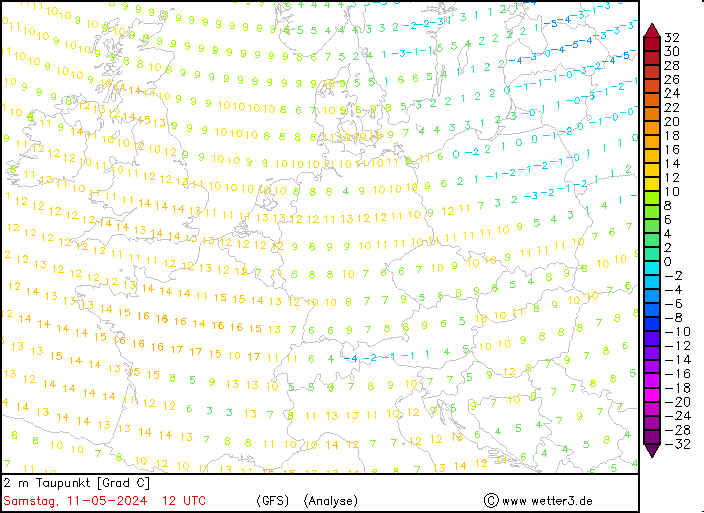
    Of course, we need to also factor in conditions at the surface. Snow can fall with surface temperatures of below around 4 °C, provided the wet-bulb temperature is at zero or below. We look at the dewpoint readings to figure this out, as the wet-bulb temperature is usually around one third of the way between the dewpoint and dry-bulb temperature. So if the dry-bulb temperature is +3 °C, and dewpoint is -2 °C, the wet-bulb temperature will be around zero or just below, and snow is pretty likely.

    Dewpoint
    00_32.gif

    All too many times, conditions in Ireland can be "marginal", with a very fine line between rain and snow. That's when the "lamppost watching" takes place, with people desperately watching for those sleety drops to turn fluffier and fall slower as snowflakes......then they come on here and proclaim to the world that they have found the white gold!


This discussion has been closed.
Advertisement