Advertisement
If you have a new account but are having problems posting or verifying your account, please email us on hello@boards.ie for help. Thanks :)
Hello all! Please ensure that you are posting a new thread or question in the appropriate forum. The Feedback forum is overwhelmed with questions that are having to be moved elsewhere. If you need help to verify your account contact hello@boards.ie

Arctic sea ice heads for record low

Options
24567

Comments

  • Closed Accounts Posts: 3,772 ✭✭✭Cú Giobach


    Nabber wrote: »
    I agree.

    But when the % for human error is higher then the % of change, then your concerns are in all likelyhood based on human error and not weather change.
    My issue is with the scare mongering, it's wrong whether weather related or not.
    Would like to discuss the charts posted since this quoted post?


  • Registered Users Posts: 8,913 ✭✭✭Danno


    MiNdGaM3 wrote: »
    Cherry picking at its best.
    I think we were looking at these charts...

    Cherry picking at best? I could say the same! The data you quoted is from a 25kmX25km dataset, the newer IMS data is 4kmX4km. I think its preferable to use more detailled input, from newer equipment, to reach a conclusion.
    MiNdGaM3 wrote: »
    When the IMS chart updates, expect that line to continue diving!

    A sort of triumph?

    [sarcasm]Say, should I just accept now and start handing over €5 per litre in carbon taxes to stop the ice melting? Sure it's the first time ever that the ice has melted this much... never happened before... never![/sarcasm] :rolleyes:


  • Closed Accounts Posts: 3,772 ✭✭✭Cú Giobach


    Danno wrote: »
    Cherry picking at best? I could say the same! The data you quoted is from a 25kmX25km dataset, the newer IMS data is 4kmX4km. I think its preferable to use more detailled input, from newer equipment, to reach a conclusion.


    A sort of triumph?

    [sarcasm]Say, should I just accept now and start handing over €5 per litre in carbon taxes to stop the ice melting? Sure it's the first time ever that the ice has melted this much... never happened before... never![/sarcasm] :rolleyes:
    There is no question about a change to the sea ice in the Arctic, this will affect weather, changing weather will affect us, this is a weather forum, people will discuss things like that here, so why the sarcasm?
    Why do people come up with comments like that at every mention of changing climatic conditions? Are people not allowed to discuss such things now? Should such discussions be confined to E-Mail?
    So what if it has happened before? So what if it is/or isn't caused by humans, are people only allowed to discuss such things if we ourselves are responsible for them?
    If you have an issue with carbon tax why don't you start a thread somewhere on it, why throw it in just to make out the discussion on a very real phenomena is somehow stupid, and just talking about it is in some odd way an attempt to justify such taxes?


  • Registered Users Posts: 921 ✭✭✭MiNdGaM3


    Danno wrote: »
    Cherry picking at best? I could say the same! The data you quoted is from a 25kmX25km dataset, the newer IMS data is 4kmX4km. I think its preferable to use more detailled input, from newer equipment, to reach a conclusion.


    A sort of triumph?

    [sarcasm]Say, should I just accept now and start handing over €5 per litre in carbon taxes to stop the ice melting? Sure it's the first time ever that the ice has melted this much... never happened before... never![/sarcasm] :rolleyes:

    I'm guessing you don't quite understand the meaning of cherry picking...

    I explained the differences between the IMS/MASIE and typical passive microwave extent data. The graphs I posted come from varying sources, with varying techniques and varying resolutions, yet all agreeing with eachother.
    The extra detail in IMS/MASIE is useful for near real-time analysis, but even the scientists working on it say it's not useful for historical comparisons.
    The loss of over 2.5 million km2 (that's over 30 times the land area of Ireland) of reflective ice for open water is going to have many effects.

    There is no triumph in having the sea ice disappear at such a fast rate, but their is joy in watching the deniers squirm and grasp at straws;)


  • Registered Users Posts: 2,855 ✭✭✭Nabber


    Would like to discuss the charts posted since this quoted post?

    As in proof that human error can't explain the large difference in scale of melting?

    Look at 2006 - 2007, what is the explanations for the difference (man found fire?)
    Like I said my issue is the scare mongering and the fact that all weather phenomenon now is 'man made'.


    We are going on a snippet of information and drawing a conclusion from that.

    The Vikings settled GreenLand 1000years ago. The Earth didn't turn into Venus like someone had mentioned.

    It's all about Cycles......


  • Advertisement
  • Registered Users Posts: 195 ✭✭gothwalk


    Nabber wrote: »
    As in proof that human error can't explain the large difference in scale of melting?

    Look at 2006 - 2007, what is the explanations for the difference (man found fire?)
    Like I said my issue is the scare mongering and the fact that all weather phenomenon now is 'man made'.

    I don't think anyone's stating that, or even anything near it. However, there's a model put forward, which uses fairly solid scientific thinking, which postulates that greenhouse gases in the atmosphere - caused by human activities, including the burning of fossil fuels, farming practices, and a whole range of others - can raise the amount of energy in the atmosphere, and that some of that rise in energy will be in the form of temperature. And that will cause feedback loops with the melting of Arctic ice, the melting of landbound icecaps in Greenland and Antarctica, and the release of further greenhouse gases from melting permafrost.

    Some of the predictions from this model, aside from the rise in temperature, are more extreme weather events, and lower limits on sea ice in the Arctic each autumn.

    Lo and behold, we are measuring rises in temperature - which are now beyond the errors of measurement - an increase in the number of extreme weather events, and lower limits on sea ice in the Arctic, including this year's record low. All these measurements are pretty thoroughly confirmed by now, peer reviewed, and not released unless they're reliable.

    It is not proven that they are due to human activities. You can't do that; science is not maths. But if you can provide a model that gives predictions that come true, then you can reliably say that you're very close to the truth.

    Given that these predictions are coming off, it's far from "scare mongering" to point out that there are further predictions of worse effects, and to be ready for them, in terms of policy, education, and resources.

    As a side observation, it's very often the people complaining of scare-mongering before an event who turn around and complain that there was no warning afterward. Can't have it both ways!
    Nabber wrote: »
    We are going on a snippet of information and drawing a conclusion from that.

    No, we're not. We're looking at an enormous body of data accumulated over several decades.
    Nabber wrote: »
    The Vikings settled GreenLand 1000years ago. The Earth didn't turn into Venus like someone had mentioned.

    It's all about Cycles......

    Well, the Viking settlement of Greenland died out pretty disastrously. That's not exactly a point in favour of your argument.

    And certainly, there are natural cycles out there. If any of them point to melting polar ice and a sea level rise, for instance, and there's a better model to support that than anthropogenic climate change, then:

    a) show it to us, and
    b) if sea level is rising due to natural causes rather than human activity, don't you think the same precautions would be useful? The sea water will be just as wet and salty.

    However, wailing about scare-mongering and natural cycles without offering reasoning, figures, or indeed, a way to handle the effects is, in short, a waste of time and effort.


  • Closed Accounts Posts: 4,279 ✭✭✭Su Campu


    gothwalk wrote: »
    Some of the predictions from this model, aside from the rise in temperature, are more extreme weather events, and lower limits on sea ice in the Arctic each autumn.

    Lo and behold, we are measuring rises in temperature - which are now beyond the errors of measurement - an increase in the number of extreme weather events, and lower limits on sea ice in the Arctic, including this year's record low. All these measurements are pretty thoroughly confirmed by now, peer reviewed, and not released unless they're reliable.

    It is not proven that they are due to human activities. You can't do that; science is not maths. But if you can provide a model that gives predictions that come true, then you can reliably say that you're very close to the truth.

    Given that these predictions are coming off, it's far from "scare mongering" to point out that there are further predictions of worse effects, and to be ready for them, in terms of policy, education, and resources.

    As a side observation, it's very often the people complaining of scare-mongering before an event who turn around and complain that there was no warning afterward. Can't have it both ways!


    I'd still like to see scientific proof that " more exteme weather events" are occuring. What is the definition of more severe? How is it quantified? Or is this just going on the general perception that weather is getting more severe, like the idiot on 2FM yesterday (don't know who he was) and his guest in New Orleans who were harping on about the problem of climate change on these hurricanes......:rolleyes: Baseless comments like that fuel the perception among the general public that hurricanes are becoming more intense and numerous when there is no evidence of this whatsoever.


  • Registered Users Posts: 195 ✭✭gothwalk


    Su Campu wrote: »
    I'd still like to see scientific proof that " more exteme weather events" are occuring. What is the definition of more severe? How is it quantified?

    Poor phrasing on my part. Not "weather events which are more extreme", but "more frequent extreme weather events".

    Essentially, there's a body of weather data built up over the last several decades, and in some areas, centuries. There are record high temperatures, low temperatures, high wind speeds, days of unbroken sunshine, days of rain, accumulated rainfall, and others.

    There's a statistical expectation as to how often these records will be broken. it varies based on how much data you have; if you've only a few years, then you can reasonably expect your records to be broken frequently, and then as your data sets get bigger, "outliers" - that is, in your data set, not necessarily in reality - will happen less frequently if conditions remain the same.

    However, if you look back across weather records for the last decade, there are more records being broken, and there are more events which are outliers, even when they don't break records. That's statistically unlikely, particularly in the British Isles, which has a very large dataset.

    You're not going to see scientific proof, though. There's no such thing. You will see a large amount of accumulated evidence, which fits particular models and doesn't fit others. At present, the accumulated evidence - as far as I can see - fits the anthropogenic climate change model. If there is evidence which does not fit it, that needs to be considered. If there's a model which fits more evidence, better, that also needs to be considered and examined.

    However, looking for "proof" is not going to do anything. If you doubt something, point out a flaw in the model or the data. There are certainly plenty of them! But at present, the evidence weighs heavily toward anthropogenic climate change.

    If you want a list of weather records matched and broken in the last decade, I can certainly find them for you. But it's far better for you to find them for yourself, and thereby guarantee that my biases toward the existing model are not in play. If what I'm saying above can then be demonstrated not to be true, then come back with that.


  • Registered Users Posts: 921 ✭✭✭MiNdGaM3


    Su Campu wrote: »
    I'd still like to see scientific proof that " more exteme weather events" are occuring. What is the definition of more severe? How is it quantified? Or is this just going on the general perception that weather is getting more severe, like the idiot on 2FM yesterday (don't know who he was) and his guest in New Orleans who were harping on about the problem of climate change on these hurricanes......:rolleyes: Baseless comments like that fuel the perception among the general public that hurricanes are becoming more intense and numerous when there is no evidence of this whatsoever.

    For the mid latitudes at least, the warming of the half ice free Arctic ocean during summer allows a large accumulation of heat in the surface layer. When Autumn arrives, that heat is released, raising the air temperature across the Arctic and increasing the atmospheric thickness.
    This then reduces the thickness gradient between the Arctic and the tropics, which has the effect of slowing the jet stream and causing higher amplitude and slower moving Rosby waves. This increases the likelihood of stuck weather patterns, allowing for more flooding and more drought, depending on whether you find yourself under the ridge or trough.
    This mainly effects the Autumn and Winter. Summer is also effected in a similar way, but by northern hemisphere snow cover reducing earlier and to lower extents, allowing more heating.

    That's one way at least, that the Arctic ice lows and snow cover lows may increase some extreme weather events.


  • Closed Accounts Posts: 4,279 ✭✭✭Su Campu


    MiNdGaM3 wrote: »
    For the mid latitudes at least, the warming of the half ice free Arctic ocean during summer allows a large accumulation of heat in the surface layer. When Autumn arrives, that heat is released, raising the air temperature across the Arctic and increasing the atmospheric thickness.
    This then reduces the thickness gradient between the Arctic and the tropics, which has the effect of slowing the jet stream and causing higher amplitude and slower moving Rosby waves. This increases the likelihood of stuck weather patterns, allowing for more flooding and more drought, depending on whether you find yourself under the ridge or trough.
    This mainly effects the Autumn and Winter. Summer is also effected in a similar way, but by northern hemisphere snow cover reducing earlier and to lower extents, allowing more heating.

    That's one way at least, that the Arctic ice lows and snow cover lows may increase some extreme weather events.

    Yes, that's the theory, but my point is that the perception has been generated that this is already happening when in fact there is no proof that it is. We have had some recent northern blocking in the past few years - especially this summer - and I would claim that that has contributed to the increased melting season this year through Greenland, etc. and not the other way around, but these satellite data we are going on are only one climate period (3 decades) old, therefore we can't claim that such ice melts didn't occur during say the similar warming of the early 20th century.


  • Advertisement
  • Closed Accounts Posts: 4,279 ✭✭✭Su Campu


    gothwalk wrote: »
    Poor phrasing on my part. Not "weather events which are more extreme", but "more frequent extreme weather events".

    It doesn't matter what way you phrase it - both ways are equally bogus. It is claimed that hurricanes should be becoming more severe but there's no evidence of such. There have always been severe droughts and floods, it's just that they are recorded more easily now and affect more people due to the higher population and the poor decisions with regard to demographic planning, etc. If the effects of such events are more severe it is because we have not developed out population centres with the effects of natural severe weather events in mind. New Orleans being a perfect example. Build a city in a known hurricane hotspot, on sinking land that is mostly below sea level. Real clever that. :rolleyes:


  • Registered Users Posts: 1,216 ✭✭✭sharper


    Su Campu wrote: »
    therefore we can't claim that such ice melts didn't occur during say the similar warming of the early 20th century.

    Satellite records are nice to have but not the only way of measuring Arctic sea ice. There are good records starting at about 1950 and less reliable sources going much further back

    http://nsidc.org/cryosphere/sotc/sea_ice.html

    mean_anomaly_1953-2011-v2.png

    http://www.skepticalscience.com/Arctic-sea-ice-hockey-stick-melt-unprecedented-in-last-1450-years.html

    Kinnard_2011_sea_ice_med.jpg


    http://earthobservatory.nasa.gov/Features/wardhunt/
    In the summer of 2002, graduate student Derek Mueller made an unwelcome discovery: the biggest ice shelf in the Arctic was breaking apart. The bad news didn’t stop there. Lying along the northern coast of Ellesmere Island in northern Canada, the Ward Hunt Ice Shelf had dammed an epishelf lake, a body of freshwater that floats on denser ocean water. This epishelf lake, located in Disraeli Fiord, was host to a rare ecosystem, and it was the largest and best-understood epishelf lake in the Northern Hemisphere. When the Ward Hunt Ice Shelf fractured, the epishelf lake suddenly drained out of Disraeli Fiord, spilling more than 3 billion cubic meters of fresh water into the Arctic Ocean.
    [...]
    When the Ward Hunt Ice Shelf originally formed, it blocked the mouth of Disraeli Fiord, cutting it off from the Arctic Ocean. In the process, the ice shelf trapped driftwood inside the epishelf lake and kept other pieces of driftwood from entering. Pieces of driftwood found along the shores of Disraeli Fiord have been there since the ice shelf formed, and by radiocarbon dating the wood, researchers have been able to estimate the minimum age of the ice shelf. “There simply are no radiocarbon dates more recent than 3,000 years before present,” said Jeffries. This ice shelf, in existence for at least three millennia, has now encountered conditions it can no longer survive.

    Note the last link - the ice shelf survived 3 thousand years and started collapsing in the early 2000s. Every metric for the Arctic is now much lower than it was even then.

    What's happening in the Arctic right now is completely unprecedented going back thousands of years and "just natural cycles" really does not cut it as an explanation.

    If you want to try and find a way to go on believing nothing is happening I'm sure you can. Real world measurement is complex and messy, you can always find room to dismiss it and claim "Well we don't really know, maybe it's just an error of some type".


  • Registered Users Posts: 921 ✭✭✭MiNdGaM3


    Su Campu wrote: »
    Yes, that's the theory, but my point is that the perception has been generated that this is already happening when in fact there is no proof that it is. We have had some recent northern blocking in the past few years - especially this summer - and I would claim that that has contributed to the increased melting season this year, but these satellite data we are going on are only one climate period (3 decades) old, therefore we can't claim that such ice melts didn't occur during say the similar warming of the early 20th century.

    We can claim it though. We have very good data of the periphery of the ice pack going well back to the 19th century. We have a lot of aerial and submarine observations from much the 20th century, with shipping logs further back, the ships couldn't get past the edge of the pack so we can't say much about the interior though!
    We do know the ice did drop back during the warming up to 1940/50 but what we're seeing now is very different.
    Some ice shelves, such as Ward Hunt, have had driftwood thousands of years old (carbon dating) trapped in the ice yet have only recently begun to break up and detach.

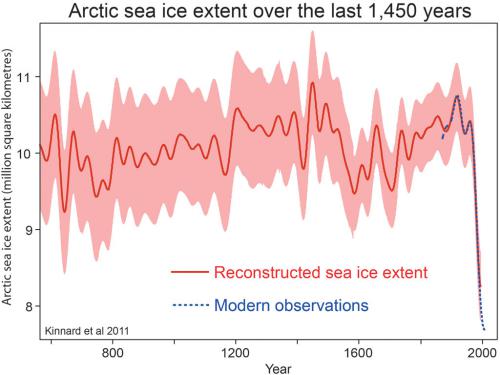
    There are several reconstructions of sea ice in the Arctic over the last 10,000 years or so. The last time the ice may have been this low could have been during the Holocene Climatic Optimum, around 8,000 years ago.

    One of the most recent reconstructions is from Kinnard et al., here's the graph from it
    Kinnard_2011_sea_ice_med.jpg

    And a link to the papers abstract here

    Which includes the line
    "both the duration and magnitude of the current decline in sea ice seem to be unprecedented for the past 1,450 years"

    EDIT: Sharper is too quick for me!


  • Registered Users Posts: 195 ✭✭gothwalk


    Su Campu wrote: »
    It doesn't matter what way you phrase it - both ways are equally bogus.

    Well, actually, no.

    First, you haven't actually addressed my point regarding statistics and outliers; you're throwing up irrelevant points about more measurements, and more people being affected. Those are true, but they don't affect the nature of the statistics: there are more outlying events, even in well-known, long established datasets. I'm also not talking at all about the effects of events; I'm talking about the measurements of weather on a day to day basis.

    For some context, read this:

    http://www.guardian.co.uk/world/2011/jun/13/extreme-weather-flooding-droughts-fires

    ... which gives an overview of the situation.

    This: http://www.bbc.co.uk/news/uk-18653274
    ... talks about the record-breaking rain in the UK earlier this year, as an example.

    ... and finally, if you're taking the sceptical route, try the fact that insurance companies, who deal only in cold hard numbers, are adjusting their premiums to handle weather:

    http://www.thejournal.ie/home-insurance-costs-to-rise-on-weather-worries-218810-Sep2011/

    They're not doing that for fun, or because they heard it from someone down the pub.
    Su Campu wrote: »
    It is claimed that hurricanes should be becoming more severe but there's no evidence of such.

    It may be so claimed. I'm not claiming that. I'm claiming that there are more outlier events than would normally be expected.
    Su Campu wrote: »
    There have always been severe droughts and floods, it's just that they are recorded more easily now and affect more people due to the higher population and the poor decisions with regard to demographic planning, etc.

    I'm not talking about those either. Indeed, I'm specifically talking about the longer established, older datasets, like British Isles weather records. The fact that there are more measurements out there - and I agree that, for example, we're aware of tropical storms that nobody would have known about thirty years ago. But that's not the kind of dataset I'm talking about.
    Su Campu wrote: »
    If the effects of such events are more severe it is because we have not developed out population centres with the effects of natural severe weather events in mind. New Orleans being a perfect example. Build a city in a known hurricane hotspot, on sinking land that is mostly below sea level. Real clever that. :rolleyes:

    And I said nothing about effects of weather. Do try to address what's going on here, not what some nebulous public is saying, old bean.


  • Registered Users Posts: 2,855 ✭✭✭Nabber


    gothwalk wrote: »
    No, we're not. We're looking at an enormous body of data accumulated over several decades.
    30years isn't enormous by any stretch of the imagination.

    Well, the Viking settlement of Greenland died out pretty disastrously. That's not exactly a point in favour of your argument.
    .

    500 years isn't really a disaster.
    The accounts of the vikings shows that Greenland went through a warm period back to a cool one.


    Sorry Gothwalk don't have time to make a full reply, appreciate your response.


  • Registered Users Posts: 195 ✭✭gothwalk


    Nabber wrote: »
    30years isn't enormous by any stretch of the imagination.

    It's not. However, 30 years is the period over which data has been gathered, not the period the data covers. We have direct measurements going back 200 years in some places, and secondary measurements from ice sediments, tree ring data, erosion patterns, pollen records, and lots of others, giving a clear picture of climate over thousands of years. We know about things like the Younger Dryas through these. It is, in fact, an enormous amount of data, and is a great deal more valid than the "sceptic" habit of handwaving and hair-splitting.


    Nabber wrote: »
    500 years isn't really a disaster.
    The accounts of the vikings shows that Greenland went through a warm period back to a cool one.

    Absolutely. Locally. But if you look at the actual data for this - like, for instance, the charts above - you'll find that their warm period was not nearly as strong as ours, nor was it worldwide.

    There is also some evidence to show that that warm period was in fact anthropogenic as well, based on greater amounts of wood-burning. I am however, sceptical about that one, because there's no model to support it - wood burning was not a new activity, nor one that does not occur in nature, whereas the burning of fossil fuels is.

    However, on a broader level, showing that something happened naturally in the past does not go anywhere toward countering the model and data based approach used by actual science (and actuaries, as noted above). Unless you can provide an actual different model, which explains more data, your point will rest with the tabloids. And I'm pretty sure you can't.


  • Closed Accounts Posts: 4,279 ✭✭✭Su Campu


    gothwalk wrote: »
    Well, actually, no.

    First, you haven't actually addressed my point regarding statistics and outliers; you're throwing up irrelevant points about more measurements, and more people being affected. Those are true, but they don't affect the nature of the statistics: there are more outlying events, even in well-known, long established datasets. I'm also not talking at all about the effects of events; I'm talking about the measurements of weather on a day to day basis.

    For some context, read this:

    http://www.guardian.co.uk/world/2011/jun/13/extreme-weather-flooding-droughts-fires

    ... which gives an overview of the situation.

    This: http://www.bbc.co.uk/news/uk-18653274
    ... talks about the record-breaking rain in the UK earlier this year, as an example.

    ... and finally, if you're taking the sceptical route, try the fact that insurance companies, who deal only in cold hard numbers, are adjusting their premiums to handle weather:

    http://www.thejournal.ie/home-insurance-costs-to-rise-on-weather-worries-218810-Sep2011/

    They're not doing that for fun, or because they heard it from someone down the pub.


    It may be so claimed. I'm not claiming that. I'm claiming that there are more outlier events than would normally be expected.


    I'm not talking about those either. Indeed, I'm specifically talking about the longer established, older datasets, like British Isles weather records. The fact that there are more measurements out there - and I agree that, for example, we're aware of tropical storms that nobody would have known about thirty years ago. But that's not the kind of dataset I'm talking about.


    And I said nothing about effects of weather. Do try to address what's going on here, not what some nebulous public is saying, old bean.

    Firstly, let's forget this insurance premium idea. Insurance premia reflect the exposure to claims. Much of the increase in claims has been the result of the poor demographic planning I mentioned. Take Ireland as one example. The increase in claims through flooding can't really be put down to staggeringly high rainfall episodes, as the data will show, but is to do with the increase exposure of policy holders to flooding through poor planning (eg. building in natural flood plains), decreased run off from increased concretisation (is that a word?), damming issues, etc. That is one example where weather events that have occured not just in recent decades but during the previous century or more are having more of an effect nowadays. Another example we see bandied about in relation to AGW is Boscastle. Another is Katrina. And most recently Isaac. So the cost of insurance is a non-runner when it comes to this discussion.

    Regarding the CET. Of course many of the warmest years have occured in recent decades, no one can deny that. But I find it interesting that these warm years seem to have come about through anomalously warmer summer and autumn months, but the warmest winter months still date back to pre-1960s (December 1974 = December 1934). For some reason the warm records are not being seen in winter. I don't know why that is as you would expect all seasons to show a rising trend, especially as, if you exclude the past two winters, the winters of the past few decades have been classed as "mild" (as in ask a snow-lover). April 2011 upset the applecart a little bit and led to the warm Spring.

    219087.PNG

    Sea ice has no doubt undergone a sharp decline in recent years, no one doubts that either. I am not denying that warming is happening, but I do dispute the extent of our influence on it. My point in this thread has been that when a flood does occur (as in a town gets flooded despite just a modest rainfall event), it is put down to AGW and not to the other factors that caused it.


  • Registered Users Posts: 8,913 ✭✭✭Danno


    http://docs.lib.noaa.gov/rescue/mwr/050/mwr-050-11-0589a.pdf

    Scroll down a little in this page and read about the state of the arctic in the 1920s... a very descriptive account by a man who sailed the area for over 50 years... what is more, is how alarmed he is about the change in just four short years. The document is NOAA, not some honest bloggers one.


  • Registered Users Posts: 1,021 ✭✭✭Coles


  • Registered Users Posts: 1,021 ✭✭✭Coles


    Danno wrote: »
    http://docs.lib.noaa.gov/rescue/mwr/050/mwr-050-11-0589a.pdf

    Scroll down a little in this page and read about the state of the arctic in the 1920s... a very descriptive account by a man who sailed the area for over 50 years... what is more, is how alarmed he is about the change in just four short years. The document is NOAA, not some honest bloggers one.
    An interesting read. The writer says that in 1922 he was able to travel by ship to 81 degrees North. It is now possible to travel to 85 degrees North.

    Map of Arctic.


  • Advertisement
  • Registered Users Posts: 921 ✭✭✭MiNdGaM3


    Danno wrote: »
    http://docs.lib.noaa.gov/rescue/mwr/050/mwr-050-11-0589a.pdf

    Scroll down a little in this page and read about the state of the arctic in the 1920s... a very descriptive account by a man who sailed the area for over 50 years... what is more, is how alarmed he is about the change in just four short years. The document is NOAA, not some honest bloggers one.

    That's just a small sample area of the Arctic, and still is nowhere near as little ice as today.

    In April and March this year, sea ice in the Bering Sea was at record highs. Hardly indicative of the current state of the Arctic, is it?

    Regional variation can still occur while the overall trend moves downward.


  • Closed Accounts Posts: 152 ✭✭catch.23


    MiNdGaM3 wrote: »
    That's just a small sample area of the Arctic, and still is nowhere near as little ice as today.

    In April and March this year, sea ice in the Bering Sea was at record highs. Hardly indicative of the current state of the Arctic, is it?

    Regional variation can still occur while the overall trend moves downward.

    Actually in April and March this year, sea ice was up pretty much everywhere, the so called ''current state'' of the artic ice usually only refers to summer/autumn ice levels. If you look at this graph you'll see that it was at the highest level in years. Unfortunately that doesn't seem to have had any bearing on ice levels this summer.


  • Registered Users Posts: 8,913 ✭✭✭Danno


    MiNdGaM3 wrote: »
    That's just a small sample area of the Arctic, and still is nowhere near as little ice as today.
    Can you back that up? Or is that just your opinion? The man in the article spent 54 years sailing that area... yet our current-day satellites have to look through clouds with dodgy sensors at a 25kmX25km range... I think I'll take his word over the satellites, thank you!
    MiNdGaM3 wrote: »
    In April and March this year, sea ice in the Bering Sea was at record highs. Hardly indicative of the current state of the Arctic, is it? Regional variation can still occur while the overall trend moves downward.

    The Arctic has been lower in the past... in order to reach a lower point it must have went through a period of time in a downward trend... thats a cycle mate... why the panic now.


  • Registered Users Posts: 8,913 ✭✭✭Danno


    Coles wrote: »
    An interesting read. The writer says that in 1922 he was able to travel by ship to 81 degrees North. It is now possible to travel to 85 degrees North.

    Map of Arctic.

    Possible to get above 81 "ice-free" in the article...

    You then say it is now possible to reach 85... think again... http://www.natice.noaa.gov/products/products_on_demand.html <<<play with that toy... the furthest I can find is only slightly above 82...


  • Closed Accounts Posts: 4,279 ✭✭✭Su Campu


    Am I missing something? This graph shows this year not as bad as 2007. :confused:

    http://www.natice.noaa.gov/products/ice_extent_graphs/arctic_weekly_ice_extent.html

    219220.PNG


  • Registered Users Posts: 1,132 ✭✭✭tphase


    that's odd alright.
    If you plot individual years, the ice extent for each point is given,
    5.6 million sq. km on Aug 26, 2007, 5.46 million sq.km on Aug 26, 2012. However on multi-year plots, 2007 shows up as lower than this year.

    Still, the general trend is for reduced ice extent.


  • Registered Users Posts: 11,134 ✭✭✭✭maquiladora


    Su Campu wrote: »
    Am I missing something? This graph shows this year not as bad as 2007. :confused:

    I could be wrong, but I think thats a graph for extent rather than area.
    What is the difference between sea ice area and extent?

    Area and extent are different measures and give scientists slightly different information. Some organizations, including Cryosphere Today, report ice area; NSIDC primarily reports ice extent. Extent is always a larger number than area, and there are pros and cons associated with each method.

    A simplified way to think of extent versus area is to imagine a slice of swiss cheese. Extent would be a measure of the edges of the slice of cheese and all of the space inside it. Area would be the measure of where there is cheese only, not including the holes. That is why if you compare extent and area in the same time period, extent is always bigger. A more precise explanation of extent versus area gets more complicated.

    http://nsidc.org/data/seaice_index/


  • Closed Accounts Posts: 4,279 ✭✭✭Su Campu


    I could be wrong, but I think thats a graph for extent rather than area.


    http://nsidc.org/data/seaice_index/

    Yeah but why the difference between the extent I posted above and this extent?

    Sea_Ice_Extent.png


  • Registered Users Posts: 11,134 ✭✭✭✭maquiladora


    Su Campu wrote: »
    Yeah but why the difference between the extent I posted above and this extent?

    Sea_Ice_Extent.png

    Ah, I see now. One is for total ice. The other is for sea ice only.


  • Advertisement
  • Closed Accounts Posts: 78 ✭✭srmambo


    Ice area now at 2.3009 and this melt rate looks to increase greatly according to the deep FI in the GFS charts.

    http://www.netweather.tv/index.cgi?action=nwdc;sess=

    If such a trend holds true, there is a the potential that the ice could melt to zero by the end of the month, especially if the melt period is extended which it will be due to the ocean temperatures.

    Could this trend set off an abrupt eruption of methane and push the world into a runaway climate change within days?


Advertisement