Advertisement
If you have a new account but are having problems posting or verifying your account, please email us on hello@boards.ie for help. Thanks :)
Hello all! Please ensure that you are posting a new thread or question in the appropriate forum. The Feedback forum is overwhelmed with questions that are having to be moved elsewhere. If you need help to verify your account contact hello@boards.ie

Arctic sea ice heads for record low

Options
12467

Comments

  • Closed Accounts Posts: 78 ✭✭srmambo


    Su Campu wrote: »
    Please do explain why you see an increase in melt rate and what's looking so unsettled about the Arctic. You seem to be constantly pushing this pessimistic idea, for whatever reason. The melt is coming to an end and we will see an increase again in the next couple of weeks. Why, even the link you posted above shows it levelled off and even on the increase.

    220387.PNG

    The GFS charts showed off some unsettled weather from the deep depressions that are shown in the image I posted.

    I understand the chart does show an increase in the ice area, but note how the amount of digits has been significantly reduced showing a huge spike in the melt rate.

    It was 2.34117, but it went down to 2.3682 which is a major drop in sea ice unless of course there is something I am missing.


  • Closed Accounts Posts: 152 ✭✭catch.23


    srmambo wrote: »
    The GFS charts showed off some unsettled weather from the deep depressions that are shown in the image I posted.

    I understand the chart does show an increase in the ice area, but note how the amount of digits has been significantly reduced showing a huge spike in the melt rate.

    It was 2.34117, but it went down to 2.3682 which is a major drop in sea ice unless of course there is something I am missing.

    2.3682 > 2.34117


  • Closed Accounts Posts: 4,279 ✭✭✭Su Campu


    srmambo wrote: »
    The GFS charts showed off some unsettled weather from the deep depressions that are shown in the image I posted.

    I understand the chart does show an increase in the ice area, but note how the amount of digits has been significantly reduced showing a huge spike in the melt rate.

    It was 2.34117, but it went down to 2.3682 which is a major drop in sea ice unless of course there is something I am missing.

    Not sure what your point is, but if you want to look at the figures that closely then it jumped from 2.29376 to 2.34117 in one day (Day 250-251). These "exact" figures are only approximations, however, as they are calculated from microwave passes which only scan the same area every few days, so we don't get total coverage every day.

    The chart you posted shows nothing special in the Arctic, and certainly nothing to hint at an increased melt.


  • Closed Accounts Posts: 78 ✭✭srmambo


    Su Campu wrote: »
    Not sure what your point is, but if you want to look at the figures that closely then it jumped from 2.29376 to 2.34117 in one day (Day 250-251). These "exact" figures are only approximations, however, as they are calculated from microwave passes which only scan the same area every few days, so we don't get total coverage every day.

    The chart you posted shows nothing special in the Arctic, and certainly nothing to hint at an increased melt.

    Oh ok, apologies for the post.


  • Registered Users Posts: 921 ✭✭✭MiNdGaM3


    Su Campu wrote: »
    Not sure what your point is, but if you want to look at the figures that closely then it jumped from 2.29376 to 2.34117 in one day (Day 250-251). These "exact" figures are only approximations, however, as they are calculated from microwave passes which only scan the same area every few days, so we don't get total coverage every day.

    The chart you posted shows nothing special in the Arctic, and certainly nothing to hint at an increased melt.

    The area is definitely on a plateau at the moment and it will take another week or so before we'll likely be able to confirm the minimum.
    The SSM/I sensor that's used on Cryosphere Today gets the vast majority of the Arctic scanned daily though.

    A new 1 day and 5 day mean record on the NSIDC extent today.


  • Advertisement
  • Registered Users Posts: 11,134 ✭✭✭✭maquiladora


    Another 80,000 sq km of sea ice lost yesterday. A new all time record low for sea ice extent. It looks like we haven't hit the minimum just yet.


  • Closed Accounts Posts: 78 ✭✭srmambo


    Another 80,000 sq km of sea ice lost yesterday. A new all time record low for sea ice extent. It looks like we haven't hit the minimum just yet.

    A result of the Tropical Storm?

    http://arctic-news.blogspot.ie/


  • Registered Users Posts: 921 ✭✭✭MiNdGaM3


    srmambo wrote: »
    A result of the Tropical Storm?

    http://arctic-news.blogspot.ie/

    Nope. What's left of the sea ice is thousands of km away from the storm, which has weakened substantially by now.
    It's most likely the result of mild southerlies eating into the ice just north of Svalbard.

    At this time of year, some ups and downs in extent and area are to be expected and is completely normal. If we continue to see new record lows being set during next week, then it will be something more unusual.


  • Closed Accounts Posts: 4,279 ✭✭✭Su Campu


    srmambo, you need to start reading other stuff on the Arctic that's a little less alarmist. ;)


  • Registered Users Posts: 921 ✭✭✭MiNdGaM3


    A new record low ice area on Cryosphere Today of 2,262,060km2. That's 642,680km2 below the record from last year.
    http://arctic.atmos.uiuc.edu/cryosphere/arctic.sea.ice.interactive.html


  • Advertisement
  • Closed Accounts Posts: 78 ✭✭srmambo


    Su Campu wrote: »
    srmambo, you need to start reading other stuff on the Arctic that's a little less alarmist. ;)

    Agreed, but would you classify this news report as warmist.

    http://www.guardian.co.uk/environment/blog/2012/sep/13/less-arctic-sea-ice-satellites


  • Closed Accounts Posts: 4,279 ✭✭✭Su Campu


    srmambo wrote: »
    Su Campu wrote: »
    srmambo, you need to start reading other stuff on the Arctic that's a little less alarmist. ;)

    Agreed, but would you classify this news report as warmist.

    http://www.guardian.co.uk/environment/blog/2012/sep/13/less-arctic-sea-ice-satellites

    It's a newspaper so therefore yes, it is alarmist. And it's the The Guardian, so definitely so!! :-)

    50% coverage at 83.5 N is not that unusual in the height of melt season. Sure they can't even get the calculations right - 83.5 N is 450 miles from the Pole, not 350!!! (1 degree latitude is 69 miles)


  • Registered Users Posts: 921 ✭✭✭MiNdGaM3


    Su Campu wrote: »
    It's a newspaper so therefore yes, it is alarmist. And it's the The Guardian, so definitely so!! :-)

    50% coverage at 83.5 N is not that unusual in the height of melt season. Sure they can't even get the calculations right - 83.5 N is 450 miles from the Pole, not 350!!! (1 degree latitude is 69 miles)

    Most of that blog post was quite accurate, despite the minor arithmetic error!
    50% coverage that far north is quite unusual though, but it was more the fact the the satellite data indicates a much higher concentration percentage.

    A MODIS composite image here, shows the low concentration ice right across the N. Pole
    http://ice-glaces.ec.gc.ca/prods/MODISCOM-F/20120910000000_MODISCOM-F_0006643754.jpg


  • Closed Accounts Posts: 4,279 ✭✭✭Su Campu


    MiNdGaM3 wrote: »
    Most of that blog post was quite accurate, despite the minor arithmetic error!
    50% coverage that far north is quite unusual though, but it was more the fact the the satellite data indicates a much higher concentration percentage.

    A MODIS composite image here, shows the low concentration ice right across the N. Pole
    http://ice-glaces.ec.gc.ca/prods/MODISCOM-F/20120910000000_MODISCOM-F_0006643754.jpg

    That blog is written for publication in a newspaper, therefore it will have a slant right off the bat. He's a journalist tagging along on an expedition and from his profile it would appear he is not qualified in this field. The "minor arithmetic error" is not so minor at all. It's almost 30% off, and 100 miles is a huge distance when it comes to speaking of ice extent, Also, as he's on a Greenpeace expedition there is already a slant to the story before they even leave port. If he were on say the Polarstern expedition then he would carry a little more credibility. Such a limitation in the fine resolution of the satellite data is not new and has been there since 1979. In fact, the error was probably larger back then. So the whole basis of his story is nothing new and just something to fill column inches. And to show he can't calculate.


  • Registered Users Posts: 921 ✭✭✭MiNdGaM3


    Su Campu wrote: »
    That blog is written for publication in a newspaper, therefore it will have a slant right off the bat. He's a journalist tagging along on an expedition and from his profile it would appear he is not qualified in this field. The "minor arithmetic error" is not so minor at all. It's almost 30% off, and 100 miles is a huge distance when it comes to speaking of ice extent, Also, as he's on a Greenpeace expedition there is already a slant to the story before they even leave port. If he were on say the Polarstern expedition then he would carry a little more credibility. Such a limitation in the fine resolution of the satellite data is not new and has been there since 1979. In fact, the error was probably larger back then. So the whole basis of his story is nothing new and just something to fill column inches. And to show he can't calculate.

    In the grand scheme of things, with the the sea ice smashing all records on every monitoring agency, with low concentration, thin ice right across the N. Pole and every region bar the Greenland sea (where ice is exported and lost) showing either joint lowest or lowest coverage on record, the small error with working out latitude distance really doesn't matter!

    He's following a scientific expedition with world renowned sea ice and climate experts. It's a learning experience for the blogger as much as it is for the readers. Overall he does a pretty good job I think.

    This year has been very unusual and is a worrying change for the Arctic. Being able to track the goings on in a scientific expedition towards the N. Pole is interesting for a lot of people.


  • Registered Users Posts: 11,134 ✭✭✭✭maquiladora


    Interesting to notice how over the past 10 days the sea ice concentration in the region of the north pole has changed. Notice how the dark purple (80-100% concentration) is being overtaken there by red (60% concentration of ice).

    WINrK.jpg

    http://arctic.atmos.uiuc.edu/CT/animate.arctic.color.0.html

    Not much longer left in the melting season now though. Next summer will be very interesting, with so much multiyear ice having melted in 2012.


  • Registered Users Posts: 921 ✭✭✭MiNdGaM3


    Interesting to notice how over the past 10 days the sea ice concentration in the region of the north pole has changed. Notice how the dark purple (80-100% concentration) is being overtaken there by red (60% concentration of ice).

    Not much longer left in the melting season now though. Next summer will be very interesting, with so much multiyear ice having melted in 2012.


    Another new record low today, of 2,239,800km2, that's 664,940km2 below the last record, and currently 2.5 million below average.
    Open water is now as far as 87N http://www.iup.uni-bremen.de:8084/ssmis/arctic_SSMIS_visual.png

    This is really beginning to look like another 2007-esque step change.


  • Closed Accounts Posts: 2,693 ✭✭✭Redsunset


    Joe bastardi gives his thoughts on this.

    http://patriotpost.us/opinion/14736


  • Registered Users Posts: 1,132 ✭✭✭tphase


    Redsunset wrote: »
    Joe bastardi gives his thoughts on this.
    Great to have an expert like Joe explain things to us...
    http://profmandia.wordpress.com/2012/08/01/hey-joe-where-you-goin-with-that-dumb-in-your-head/


  • Registered Users Posts: 2,246 ✭✭✭rc28


    Seriously, Joe Bastardi is not exactly a 'balanced' source in this debate (I'm not saying the other sources linked are balanced either btw). Joe B has really no credibility in my experience from years of seeing his over-dramatic forecasts. Specifically on his climate knowledge, the fact he contributes to fox news says all you need to know. :pac:


  • Advertisement
  • Closed Accounts Posts: 4,279 ✭✭✭Su Campu


    I've mentioned about the effect of the PDO and AMO on northern hemisphere climate in the past and got slated here, but at the risk of getting more abuse, here it is again!

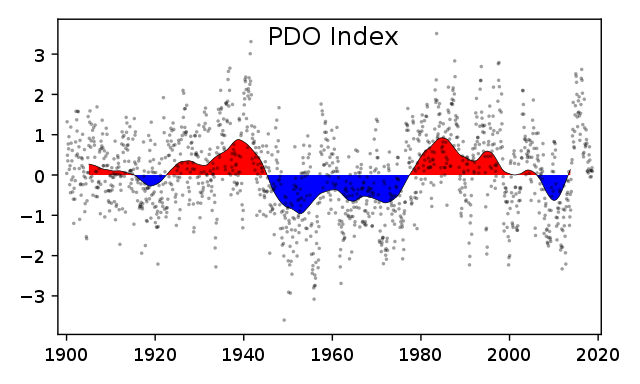
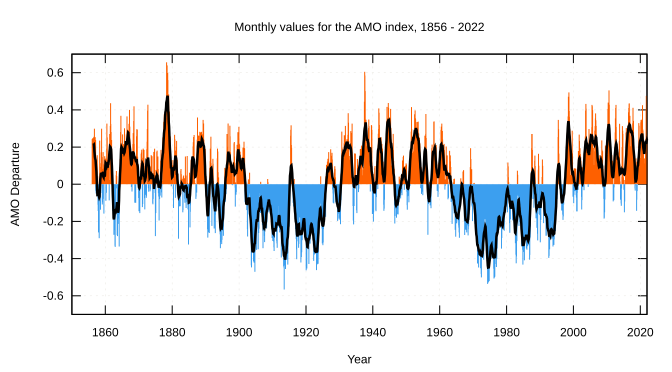
    Over the past century there has been a notable fall in sea ice extent occuring when the end of a warm PDO coincides with the middle phase of a warm AMO. The green summer graph below shows that these sudden falls at 1952-53 and 2006-07 displace the common baseline downwards for future years, and the PDO and AMO graphs under that show that these occur at the end of the warm PDOs and when the AMO is in full warm mode.

    As to why the baseline doesn't recover during cold phases? It appears that over the period shown by the black running mean curve there have been around 20% more warm PDO years than cold.

    It will be interesting to watch how the ice plays out within the next decade or so when the AMO flips back negative.

    seasonal.extent.1900-2010.png

    640px-PDO.svg.png

    672px-Amo_timeseries_1856-present.svg.png


  • Registered Users Posts: 921 ✭✭✭MiNdGaM3


    Joe B is a complete joke. At times he displays less wit than the Watts and Goddards of the debate.

    As for the AMO Su, you may be interested in this paper http://iopscience.iop.org/1748-9326/7/3/034011?fromSearchPage=true

    The PDO goes through oscillations while the sea ice is in a long term decline, so it doesn't work.
    Besides, the PDO averaged out over all available years is actually slightly below 0, showing once more why eyeballing graphs with something as complex as climate is completely futile.
    220768.GIF

    Here's a link to the data http://jisao.washington.edu/pdo/PDO.latest


  • Closed Accounts Posts: 4,279 ✭✭✭Su Campu


    A downward trend in summer extent actually began after the 50s, during the relative global cooling period pre-70s, and has accelerated in recent decades, as you would expect with the cumulative effect of proportionately more sea surrounding increasingly less ice. This therefore hints that it was something more than anthropogenic forcing that started this trend. I'm saying that if you look closer it is more marked during warm AMO, but also after a warm PDO, which has become more dominant in recent centuries, and around 20% more so in the last 100 years or so (around 57 warm years versus 47 cold). This warmer bias could be the reason for the increasingly downward trend we see in the chart above. You showed the AMO can account for up to 30% of the difference, and I'm just pointing out another pattern in the records that is fairly obvious to anyone looking at it objectively, eyeballing or not.

    PDO reconstruction from 990 to present day.

    800px-PDO1000yr.svg.png


  • Closed Accounts Posts: 78 ✭✭srmambo


    Sorry to detract the topic, but with regards the Arctic methane apparently emissions in the Arctic Ocean have been observed

    http://english.ruvr.ru/2012_09_15/Methane-emissions-discovered-in-Arctic-Ocean/


  • Closed Accounts Posts: 4,279 ✭✭✭Su Campu


    Here's a link to the weekly reports from the German ice breaker Polarstern, which has been carrying out ice and geochemical and biological studies in the Laptev Sea and wider Artic over the past month.

    http://www.awi.de/en/infrastructure/ships/polarstern/weekly_reports/all_expeditions/ark_xxvii/ark_xxvii3/


  • Closed Accounts Posts: 4,279 ✭✭✭Su Campu


    Meanwhile, on the other side of the globe, Vostok has just reached its lowest temperature of the winter so far in the last hour, reaching -82.7 °C! Hard to believe that station's fully manned 24/7!

    http://www.ogimet.com/cgi-bin/gsynres?ind=89606&lang=en&decoded=yes&ndays=2&ano=2012&mes=09&day=15&hora=18


  • Registered Users Posts: 1,645 ✭✭✭Daniel2590


    Su Campu wrote: »
    Meanwhile, on the other side of the globe, Vostok has just reached its lowest temperature of the winter so far in the last hour, reaching -82.7 °C! Hard to believe that station's fully manned 24/7!

    http://www.ogimet.com/cgi-bin/gsynres?ind=89606&lang=en&decoded=yes&ndays=2&ano=2012&mes=09&day=15&hora=18

    What does the d in Td (C) mean? Temperature (something) celsius. It has -86.2 below it.


  • Closed Accounts Posts: 4,279 ✭✭✭Su Campu


    Daniel2590 wrote: »
    What does the d in Td (C) mean? Temperature (something) celsius. It has -86.2 below it.

    Dewpoint


  • Registered Users Posts: 1,645 ✭✭✭Daniel2590


    Su Campu wrote: »
    Dewpoint

    Thanks :)


  • Advertisement
  • Registered Users Posts: 11,134 ✭✭✭✭maquiladora


    Latest JAXA data showing another 65,000 sq km loss yesterday.

    A few more days to go before we finally get the minimum figures for this season. I think it will start to level off around the 20th.


Advertisement