Advertisement
If you have a new account but are having problems posting or verifying your account, please email us on hello@boards.ie for help. Thanks :)
Hello all! Please ensure that you are posting a new thread or question in the appropriate forum. The Feedback forum is overwhelmed with questions that are having to be moved elsewhere. If you need help to verify your account contact hello@boards.ie

Autumn/Winter FI Charts 2012/13

Options
11011121315

Comments

  • Closed Accounts Posts: 1,576 ✭✭✭patneve2


    Well, the 12z GFS shows an upgrade in the short term with easterly winds and precipitation on the E. Coast. This was to be expected as the 06z ensembles showed that this morning's GFS run was a mild outlier (in the short term). Now, lets see where it goes from here.

    oops wrong thread...


  • Registered Users Posts: 352 ✭✭kkontour


    235562.png


  • Registered Users Posts: 9,017 ✭✭✭Tom Cruises Left Nut


    Bank !

    gens-20-0-360_oqm2.png


  • Registered Users Posts: 2,855 ✭✭✭Nabber


    We are still no closer to resolving this.

    At 144hrs the UKMO, ECMWF & GFS are worlds apart.
    To be honest I think the GFS is the one to watch, purely because it looks right for our weather pattern and more beleivable. The SSW is not the ace of spades, still pot luck if you get want you want from it.
    The eyecandy charts are still out in +300hr frame.

    Interesting times all the same :)

    UKMO
    13011600_1000.gif

    ECMWF
    13011600_1000.gif

    GFS
    13011606_1006.gif


  • Moderators, Technology & Internet Moderators Posts: 17,134 Mod ✭✭✭✭cherryghost


    Oh hello.

    235997.png


  • Advertisement
  • Registered Users Posts: 522 ✭✭✭Conor30


    The Ultimate FI!! (From the Moscow model!):p:p:p:p

    wmc-1-120.png


  • Posts: 31,118 ✭✭✭✭ [Deleted User]


    TILT! :D


  • Registered Users Posts: 1,645 ✭✭✭Daniel2590


    Conor30 wrote: »
    The Ultimate FI!! (From the Moscow model!):p:p:p:p

    wmc-1-120.png

    Has this updated? :s


  • Registered Users Posts: 11,134 ✭✭✭✭maquiladora


    Daniel2590 wrote: »
    Has this updated? :s

    Yes. Dynamic images can look pretty funny in these threads after the model updates to something erm less dramatic.


  • Registered Users Posts: 352 ✭✭kkontour


    Looks like the north pole is gone!
    gemnh-0-156_zqq7.png


  • Advertisement
  • Registered Users Posts: 78 ✭✭Fluffycloud


    Brrrrrrrrrrrrrrttt cold looking at chart. Two duvets on my bed.


  • Registered Users Posts: 9,017 ✭✭✭Tom Cruises Left Nut


    Gwan P5

    gens-5-0-312_ofx2.png

    Hup there ya boyo P12

    gens-12-0-276_hwg8.png


  • Registered Users Posts: 9,017 ✭✭✭Tom Cruises Left Nut


    P16, ya little tease ya

    gens-16-0-300_oga5.png


  • Registered Users Posts: 130 ✭✭Snowmaker


    whoooaaa... Perturbation 15 on the 12z GEFS is coooolll!
    Yeh, yeh! Perturbation 15 rocks!! boi-oi-oi-oi-oinnnggggg!!...hehehe, yeh... hehe.. you said perturbation...

    237004.jpg

    237005.png


  • Registered Users Posts: 1,789 ✭✭✭BEASTERLY


    Storm for the South East! Long may the undercutting continue!

    ECM1-216_cud6.GIF


  • Registered Users Posts: 6,141 ✭✭✭Elmer Blooker


    The return of the Russian monster high?
    MT mentioned a big high in the Finland/ NW Russia area in his freezing Feb prediction a few days ago and I suggested in December that very large winter anticyclones have a habit of re establishing in more or less the same area.
    Both GFS and ECM show this high at +216 but whether it continues on future runs is another matter altogether. We'll live in hope.

    Recm2161.gif


  • Registered Users Posts: 1,645 ✭✭✭Daniel2590


    Take a look at the CFS from around +600 on.. how's that for some eye candy :D

    cfs-2-672_yku6.png

    -16 850s over the east and north. -22 850s reaching south east UK :eek:


  • Registered Users Posts: 500 ✭✭✭Spindle


    Daniel2590 wrote: »
    Take a look at the CFS from around +600 on.. how's that for some eye candy :D

    cfs-2-672_yku6.png

    -16 850s over the east and north. -22 850s reaching south east UK :eek:

    :eek::eek:

    If only ;) +600 is about as FI as you can get when FI at the moment is around 96+ or even less.


  • Registered Users Posts: 1,789 ✭✭✭BEASTERLY


    18z FI looks fun!
    gfs-0-384_lil9.png


  • Moderators, Science, Health & Environment Moderators Posts: 7,146 Mod ✭✭✭✭pistolpetes11


    BEASTERLY wrote: »
    18z FI looks fun!
    gfs-0-384_lil9.png

    Ive pretty much given up on anything from this "spell" , kinda had from get go but like yourself I see me some FI Candy

    Rtavn3841.png


  • Advertisement
  • Closed Accounts Posts: 1,101 ✭✭✭Weathering


    That would be the real mc coy there pete
    No more despising what the English are getting if that happens


  • Registered Users Posts: 2,855 ✭✭✭Nabber


    Why hello mr Azores, you killed us last year. But I'll take this please

    13020606_2106.gif


  • Registered Users Posts: 11,134 ✭✭✭✭maquiladora


    A few of the GFS ensembles has thrown up the most intense Atlantic low I have ever seen in 8 years of model watching, and not in distant FI, but on day 5.

    QF6rYP8.png

    M7MSzO0.png

    Yes, thats 915mb. And that on a low res chart, in reality the pressure would even be a bit lower than that.

    To put that into context, the historic 1839 'Night Of The Big Wind' storm was estimated to have reached between 918mb to 930mb at it's most intense.

    Even some major Cat 5 hurricanes like Andrew never reached 915mb. Simply amazing to see a non-tropical Atlantic low with that kind of pressure, even if it is only on GFS ensembles charts.


  • Closed Accounts Posts: 1,745 ✭✭✭whitebriar


    A few of the GFS ensembles has thrown up the most intense Atlantic low I have ever seen in 8 years of model watching, and not in distant FI, but on day 5.

    QF6rYP8.png

    M7MSzO0.png

    Yes, thats 915mb. And that on a low res chart, in reality the pressure would even be a bit lower than that.

    To put that into context, the historic 1839 'Night Of The Big Wind' storm was estimated to have reached between 918mb to 930mb at it's most intense.

    Even some major Cat 5 hurricanes like Andrew never reached 915mb. Simply amazing to see a non-tropical Atlantic low with that kind of pressure, even if it is only on GFS ensembles charts.
    It makes some sort of sense,I suppose when you have much colder than usual air modeled into a warm atlantic.


  • Registered Users Posts: 327 ✭✭tomcosgrave


    I take it Maq, that the low will not be that extreme though, even though it's modelled for only 5 days out?


  • Registered Users Posts: 11,134 ✭✭✭✭maquiladora


    I take it Maq, that the low will not be that extreme though, even though it's modelled for only 5 days out?


    The current 12Z GFS op brings it down to 920mb.

    3BqQsKY.jpg

    There would need to be a fairly significant shift in track for it to seriously impact us though. It's just interesting to see from a model watching point of view.

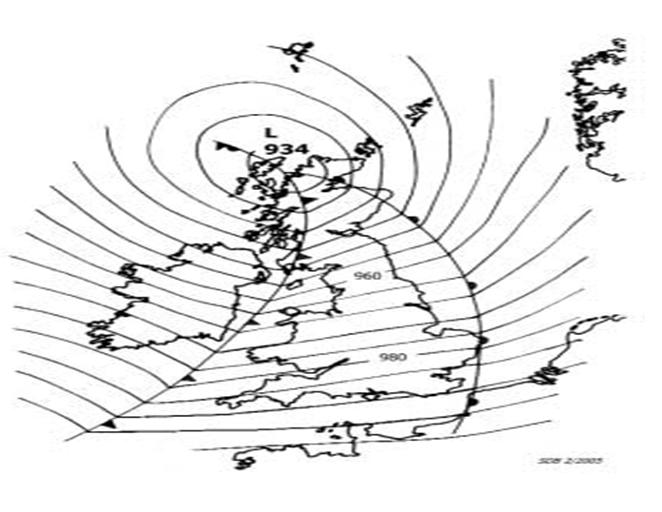
    A chart showing the 1839 storm for comparison.

    chart+3.jpg


  • Registered Users Posts: 327 ✭✭tomcosgrave


    I just wonder if it's not distorted, given it's winter and not hurricane season etc.


  • Registered Users Posts: 2,855 ✭✭✭Nabber


    It can't go much lower than it is. But if it maintains it's shape, we maybe looking at an extra colour added into the charts to represent it's wind speeds :)

    13012612_2112.gif

    gfs-0-132.png?12?12


  • Registered Users Posts: 11,134 ✭✭✭✭maquiladora


    I just wonder if it's not distorted, given it's winter and not hurricane season etc.

    As whitebriar said above, it's due to unusual situation of much colder air than usual moving into the Atlantic, allowing extreme cyclogenesis.


  • Advertisement
  • Moderators, Technology & Internet Moderators Posts: 17,134 Mod ✭✭✭✭cherryghost


    Just for the record, the lowest pressure system ever recorded was Super Typhoon Tip in 1979, when it dipped to 870mb


Advertisement