Advertisement
If you have a new account but are having problems posting or verifying your account, please email us on hello@boards.ie for help. Thanks :)
Hello all! Please ensure that you are posting a new thread or question in the appropriate forum. The Feedback forum is overwhelmed with questions that are having to be moved elsewhere. If you need help to verify your account contact hello@boards.ie
Arctic Sea Ice Watch
Options
Comments
-
Current sea ice extent Vs average over the last 7 days:

Coming close to the minimum extent now, which I think occurs in early Sept on average if I am not mistaken? However, it remains to be seen how this much ice extent will increase this year as the waters around the Arctic region are extremely warm at the moment, and are likely to remain so during the coming Autumn season.
Edit: Latest SST anomalies from DMI:
Depressing.
0 -
-
If you agree with Judith Curry, Roy Spencer, Ray Bates etc who say that climate science suffers a systemic bias in favour of alarmism, and that climate scientists suffer from pressure from funders and peers to conform to the 'established truth' about global warming, please explain why Exxon Mobil's own internal research overwhelmingly agrees with the AGW climate hypothesis.
If any scientists would be given free reign to follow the data and conclude that global warming is natural, it would be the scientists employed by Exxon Mobil who have a massive corporate interest in downplaying the polluting effects of their primary product.
A new study confirms this, and also confirms what everyone really ought to already know. The climate misinformers are not the professional climate scientists, they're the marketing and PR agents of these industries. 80% of Exxon Mobil's public statements on Climate change have been to downplay or deny the link to their products.
If it wasn't for the deliberate obstructionism by these companies, we would probably be a lot further down the process of switching to carbon neutral economy
https://www.irishtimes.com/news/world/exxonmobil-misled-public-for-40-years-on-climate-change-study-finds-1.31959210 -
Wow. You posted a piece saying that an oil company was downplaying global warming. As if we didn't already know that. How you link their commercial interests to Bates, Curry and the others is less clear, though. Are you saying they were/are on the payroll? I don't quite see what that has to do with Arctic sea ice.
I don't believe anything anyone with a vested interest says without first analysing the data for myself. An oil company is the last place I would look for balanced debate. We need to ween off oil and that's a given. We have no choice. We will run out otherwise. It's a no brainer to go with renewable energy.0 -
Also, weather and climate models are inherently probabilistic. If your standard of evidence is 'individual weather event definitely caused by global warming' then you are setting the standards of evidence beyond what any reasonable person would accept.
Yet that is what you have been doing, as recently as this morning in relation to the flooding in the north. Every weather even now is inevitably followed up with comments relating to climate change, yet there is never any shred of analysis of the conditions on the day. 2003 Europe heatwave: global warming. Syrian drought: global warming. Portugal fires: global warming.The research on global warming says that extreme weather will be more likely. And we are already seeing a large increase in the number and scale of extreme weather events. But no scientist is going to publish a paper saying x drought definitely wouldn't have happened without global warming.
I still don't see the evidence for this large increase in extreme weather events. What I do see is a huge increase in reports of weather events (with social media such an influence). The reason no scientist will publish such a paper is because it's impossible to prove. That's my point, yet people are in like a flash with the gw angle after every event.You've just shown me 3 graphs that show global warming is affecting rainfall and temperatures in the fertile cresent coupled with a load of whataboutery regarding their irrigation system. The fact is, it was the worst drought in decades and their crops failed.
Have I? I posted almost a century of data showing NO effect of warming on the drought. The only upward trend has been in the last 2 decades. Can you definitely state that this is due to warming, or is there another teleconnections at play? Models say the chances of a drought are increased, but that doesn't eliminate other contributors. The recent trend is similar to previous short-term blips, only longer.Would there still have been a civil war if the drought wasn't so bad? Maybe. Probably?, nobody knows, Crop failures are definitely one of the reasons people took to the streets, but other factors also pushed people towards rebellion, but given that the drought was so bad, was the civil war exacerbated by all the displaced and starving people. OF course it was.
And was the crop failure caused by the pitiful water system and decreased flow from Turkey? Of course it was.0 -
Advertisement
-
Global warming affects all weather. You were trying to get me to say that there would have definitely been no syrian drought without climate change. I am saying that's impossible to know, but that drought that did happen was likely to have been worse due to global warming.Gaoth Laidir wrote: »Yet that is what you have been doing, as recently as this morning in relation to the flooding in the north. Every weather even now is inevitably followed up with comments relating to climate change, yet there is never any shred of analysis of the conditions on the day. 2003 Europe heatwave: global warming. Syrian drought: global warming. Portugal fires: global warming.
And in relation to this weeks flooding, Peter Thorne, of Maynooth University, director of the Irish Climate Analysis and Research Units has said that these kinds of events are exactly what is predicted in the climate models. Well see many more of these kinds of events in the future as the planet continues to warm.
All of the 'alarmism' that you accuse me of is basically exactly what Professor Thorne says we should be preparing for.Met Eireann described the storm as a one-in-a-100 years occurrence but Prof Thorne said while the exact conditions that caused this particular event were very rare in Ireland, the immense volume of rain that fell was an established hallmark of climate change.
“One of the strongest signals in climate change is an increased frequency of intense rainfall events,” he said. “For every degree the globe warms, the atmosphere can hold another 7% water vapour and, fundamentally, what goes up must come down.”...
....“Even if we stick to the efforts articulated in the Paris Agreement we are still going to pump a lot more carbon dioxide and other greenhouse gases into the atmosphere so climate change is going to get worse,” he said.
“We have developed infrastructure based on the climate so any change is bad because it puts at risk elements of infrastructure — transport, the built environment, agriculture. Everything that we depend on is set up for today’s climate so Ireland will be affected by climate change. We may not see massive heatwave events that cause mass mortality, we may not see hurricanes, but we will see climate changes that fundamentally impact on Ireland and Ireland’s way of life.”
http://www.irishexaminer.com/ireland/an-inconvenient-truth-warning-of-more-extreme-weather-as-climate-change-effects-hit-home-457642.html
You don't see the evidence because you've got your head buried in the sand. Impact attribution of global warming was in the IPCC reports and there are dozens of peer reviewed articles on the subject every year.I still don't see the evidence for this large increase in extreme weather events. What I do see is a huge increase in reports of weather events (with social media such an influence). The reason no scientist will publish such a paper is because it's impossible to prove. That's my point, yet people are in like a flash with the gw angle after every event.
One such study is a meta analysis of other studies, published in the Bulletin of the American Meteorological Society , there is an annual report looking at the extreme weather events that happened the previous year and whether there is a climate change impact
Here is part of the abstract of the 2015 report
The full report can be read here, as well as links to the previous 4 reports.This fifth edition of explaining extreme events of the previous year (2015) from a climate perspective continues to provide evidence that climate change is altering some extreme event risk. Without exception, all the heat-related events studied in this year’s report were found to have been made more intense or likely due to human-induced climate change, and this was discernible even for those events strongly influenced by the 2015 El NiFurthermore, many papers in this year’s report demonstrate that attribution science is capable of separating the effects of natural drivers including the strong 2015 El Nirom the influences of long-term human-induced climate change.....
...Confidence in results and ability to quickly do an attribution analysis depend on the “three pillars” of
event attribution: the quality of the observational record, the ability of models to simulate the event, and our
understanding of the physical processes that drive the event and how they are being impacted by climate change.
A result that does not find a role for climate change may be because one or more of these three elements is
insufficient to draw a clear conclusion. As these pillars are strengthened for different event types, confidence in
the presence and absence of a climate change influence will increase.
This year researchers also link how changes in extreme event risk impact human health and discomfort during
heat waves, specifically by looking at the role of climate change on the wet bulb globe temperature during a
deadly heat wave in Egypt. This report reflects a growing interest within the attribution community to connect
attribution science to societal impacts to inform risk management through “impact attribution.” Many will
watch with great interest as this area of research evolves in the coming years.
https://www.ametsoc.org/ams/index.cfm/publications/bulletin-of-the-american-meteorological-society-bams/explaining-extreme-events-from-a-climate-perspective/
Those graphs show warming and drought accelerating over the 20th century and into the 21st century which is what we expect it to show.Have I? I posted almost a century of data showing NO effect of warming on the drought. The only upward trend has been in the last 2 decades. Can you definitely state that this is due to warming, or is there another teleconnections at play? Models say the chances of a drought are increased, but that doesn't eliminate other contributors. The recent trend is similar to previous short-term blips, only longer.
Water systems fail when there is drought. The worse the drought, the more they fail. It's baffling that you refuse to acknowledge that a severe drought wasn't at least partially to blame for a lack of water.And was the crop failure caused by the pitiful water system and decreased flow from Turkey? Of course it was.
Do you expect increased flow from Turkey during the worst drought since instruments began?
What you're basically doing, is blaming the Turkish and the Syrians for the water shortages because they didn't invest enough in their irrigation systems and refusing to acknowledge that climate change also had a role.0 -
My point is that it's hard to claim that climate scientists are being bullied out of academia because of pressure from institutions and funders to only report pro-agw findings, when even the scientists working on behalf of the biggest oil company in the world still find that anthroprogenic global warming is a real problemGaoth Laidir wrote: »Wow. You posted a piece saying that an oil company was downplaying global warming. As if we didn't already know that. How you link their commercial interests to Bates, Curry and the others is less clear, though. Are you saying they were/are on the payroll? I don't quite see what that has to do with Arctic sea ice.
I'm pointing out that their victim complex is just them feeling sorry for themselves because the scientific community disagrees with their opinion and their studies don't have the impact they think they deserve.
When you have greenpeace funding an environmental study, it's not surprising when they find in favour of the environment. When you have Exxon Mobil publishing on climate change, it's not surprising when they find that climate change is not caused by oil. But what we have here, is an analysis of internal documents that show that even Exxon Mobil's own scientists were telling them that it's real, but they chose to lie to the publicI don't believe anything anyone with a vested interest says without first analysing the data for myself. An oil company is the last place I would look for balanced debate. We need to ween off oil and that's a given. We have no choice. We will run out otherwise. It's a no brainer to go with renewable energy.
It demolishes the 'pro agw bias' argument that the contrarians use as a crutch to explain why they're not convincing their peers.0 -
And in relation to this weeks flooding, Peter Thorne, of Maynooth University, director of the Irish Climate Analysis and Research Units has said that these kinds of events are exactly what is predicted in the climate models. Well see many more of these kinds of events in the future as the planet continues to warm.
I know that, though there's not much sign of it happening yet on our local scale, despite 110 years of warming. Not much trend in water vapour or rainfall stats, according to Met Éireann's own data. I would expect to see some sort of a signal in both over the past century, wouldn't you? Unless you have some other record of an increase in heavy rainfall events here that you can share?
 You don't see the evidence because you've got your head buried in the sand. Impact attribution of global warming was in the IPCC reports and there are dozens of peer reviewed articles on the subject every year.
One such study is a meta analysis of other studies, published in the Bulletin of the American Meteorological Society , there is an annual report looking at the extreme weather events that happened the previous year and whether there is a climate change impact
Here is part of the abstract of the 2015 report
The full report can be read here, as well as links to the previous 4 reports.
https://www.ametsoc.org/ams/index.cfm/publications/bulletin-of-the-american-meteorological-society-bams/explaining-extreme-events-from-a-climate-perspective/
Head buried in the sand. Fine. You make it all sound so easy and conclusive, yet we're still only talking about probabilities, and many events occur with no human influence, as outlined in the first chapter (below). That's why I continually ask you why every event is automatically attributed to agw before any analysis takes place.The science has now advanced to the point that we can detect the effects of climate change on some events with high confidence (e.g., especially those linked to temperature), although results are necessarily probabilistic and not deterministic.A large number of papers published in this report over the past five years (~35%) did not find any role for climate change on the risk of the event, and we expect to continue receiving and publishing similarly-themed manuscripts in the future.Those graphs show warming and drought accelerating over the 20th century and into the 21st century which is what we expect it to show.
No they don't, they show a flat trend through most of the 20th century followed by an abrupt hockey stick-type turn in the past 20 years. Where's the slowly rising trend from 1900 onwards?Water systems fail when there is drought. The worse the drought, the more they fail. It's baffling that you refuse to acknowledge that a severe drought wasn't at least partially to blame for a lack of water.
Do you expect increased flow from Turkey during the worst drought since instruments began?
What you're basically doing, is blaming the Turkish and the Syrians for the water shortages because they didn't invest enough in their irrigation systems and refusing to acknowledge that climate change also had a role.
Where did I say that? I said that even before the latest drought there was increasing pressure on resources due to increasing population and the poor system and reduced flows. This is mentioned in the article. Of course a drought makes this worse, but you dismissed these points as "whataboutery" and not significant.0 -
There is a trendGaoth Laidir wrote: »I know that, though there's not much sign of it happening yet on our local scale, despite 110 years of warming. Not much trend in water vapour or rainfall stats, according to Met reann's own data. I would expect to see some sort of a signal in both over the past century, wouldn't you? Unless you have some other record of an increase in heavy rainfall events here that you can share?
This graph is from the same page you got your links from.
And this is what Met Eireann have to say based on the data
Rainfall shows great year to year variability. A 30 year running mean of the national annual rainfall indicated an increase in average national rainfall of approximately 70mm over the last two decades.
As with the annual totals of rainfall, all seasons show a small increase in totals over the last few decades.
https://www.met.ie/climate-ireland/rainfall.asp
Your interpretation of the data, that there isn't a trend, is different from Met Eireann's interpretation of the Data.
It takes decades to establish for certain that a long term trend is there, and not just a statistical outlier, but if we wait for the trend to establish itself to the satisfaction of everyone, it will already be way too late to do anything about it. This is why we need to put our trust in the models and the predictions of these well established models.
Head buried in the sand because there are mountains of evidence showing current impacts of climate change but you don't accept them because scientists speak like scientists and use P values instead of more emotive language (even though it might be warranted given the stakes)Head buried in the sand. Fine. You make it all sound so easy and conclusive, yet we're still only talking about probabilities, and many events occur with no human influence, as outlined in the first chapter (below). That's why I continually ask you why every event is automatically attributed to agw before any analysis takes place.
And because even if these individual events are natural disasters that would have happened anyway, given that the climate models are warning that these kinds of events will happen more often and be more intense we should take them as a kick up the arse while they're still considered extreme and not the new normal. When these events are normal, imagine what the new extreme events will look like?
You must be looking at different graphs to me. The rainfall graph starts off mostly above the average, then moves to about half above average, half below average, and ends mostly below average. That's a fairly consistent trend downwards. (I have to use my own judgement because the graph doesn't plot any rolling average for the whole series)No they don't, they show a flat trend through most of the 20th century followed by an abrupt hockey stick-type turn in the past 20 years. Where's the slowly rising trend from 1900 onwards?
The temperature graph is clearly trending upwards for the whole time series, and the PDSI graph, which is the most useful of the 3, is blatantly curving downwards. (It's a drought severity index that only looks at rainfall and evaporation, so even if rainfall is the same, when temperature goes up, drought increases as the rain evaporates faster, when rainfall decreases along with temperature increasing, we get big changes in the drought severity index)
This whole Syria debate is because you wanted me to show an example of climate change being a threat multiplier, and it turns out you agreed with me all along.Where did I say that? I said that even before the latest drought there was increasing pressure on resources due to increasing population and the poor system and reduced flows. This is mentioned in the article. Of course a drought makes this worse, but you dismissed these points as "whataboutery" and not significant.
The drought made the pressures on population worse, which in turn exacerbated the Syrian civil war.
Do you get what I've been saying yet?
Now guess what's going to happen to regions that rely on glacial melt water when those glaciers are gone due to climate change. Will the wars in these regions have political dimensions? Yes, will the lack of water and mass displacement of people be a major problem that might cause tensions to spill over into civil war? Probably. Will the influx of refugees cause political crises in neighbouring countries? We're seeing that happen in Europe today, why would China and India etc be any different?0 -
There is a trend
This graph is from the same page you got your links from.
And this is what Met Eireann have to say based on the data
Rainfall shows great year to year variability. A 30 year running mean of the national annual rainfall indicated an increase in average national rainfall of approximately 70mm over the last two decades.
As with the annual totals of rainfall, all seasons show a small increase in totals over the last few decades.
Your interpretation of the data, that there isn't a trend, is different from Met Eireann's interpretation of the Data.
It sure is. I fail to see which seasons show an increase, other than summer. If anything autymn, winter and spring show a decrease. I'm not sure how they got the 70-mm annual increase from that data, but even so, it relates to less than a 0.6% increase, and I'm still waiting to see evidence that it was made up from increased flash flood events.It takes decades to establish for certain that a long term trend is there, and not just a statistical outlier, but if we wait for the trend to establish itself to the satisfaction of everyone, it will already be way too late to do anything about it. This is why we need to put our trust in the models and the predictions of these well established models.
But wait, you said there IS a trend. Now you're saying we won't know for decades? Which is it?Head buried in the sand because there are mountains of evidence showing current impacts of climate change but you don't accept them because scientists speak like scientists and use P values instead of more emotive language (even though it might be warranted given the stakes).
Don't worry, you speak enough emotive hyperbole for everyone! And because even if these individual events are natural disasters that would have happened anyway, given that the climate models are warning that these kinds of events will happen more often and be more intense we should take them as a kick up the arse while they're still considered extreme and not the new normal. When these events are normal, imagine what the new extreme events will look like?
Or we should reduce the impacts of current events by not building on flood planes, by dredging rivers, increasing natural soakage and reducing artificial runoff.
We need to get away from fossil fuels because if we don't we will run into an energy crisis far more serious than any future climate change scenarios.You must be looking at different graphs to me. The rainfall graph starts off mostly above the average, then moves to about half above average, half below average, and ends mostly below average. That's a fairly consistent trend downwards. (I have to use my own judgement because the graph doesn't plot any rolling average for the whole series)
The temperature graph is clearly trending upwards for the whole time series, and the PDSI graph, which is the most useful of the 3, is blatantly curving downwards. (It's a drought severity index that only looks at rainfall and evaporation, so even if rainfall is the same, when temperature goes up, drought increases as the rain evaporates faster, when rainfall decreases along with temperature increasing, we get big changes in the drought severity index).
Blatantly downward? As I said earlier, where is the trend before the past 2 decades? To help you see it I've removed both ends to show 1930-2000. Now, where are these blatant trends you speak of? Rainfall and PDSI falling? Nope. I see no response in either to the temperature trend. As I said, the past 2 decades show an abrupt change, but why not the early century warming or since 1970? 0
0 -
Advertisement
-
Interesting article on the northern artic route is becoming more accessible.
https://www.theguardian.com/environment/2017/aug/24/russian-tanker-sails-arctic-without-icebreaker-first-time0 -
Maybe you've discovered an error made by Met Eireann in their analysis of their data, you should contact them to let them know.Gaoth Laidir wrote: »It sure is. I fail to see which seasons show an increase, other than summer. If anything autymn, winter and spring show a decrease. I'm not sure how they got the 70-mm annual increase from that data, but even so, it relates to less than a 0.6% increase, and I'm still waiting to see evidence that it was made up from increased flash flood events.
Or maybe you're reading the data wrong. They all show an increase over the 30 years. The average rainfall at the beginning of the 30 years was lower than the average rainfall at the end of the graph for all 4 seasons. And the green line is the average of all years in that 30 year period.
Remember earlier in our discussion when I said I didn't think I am qualified to assess raw data in published peer reviewed papers, so I trust the conclusions of the experts, and you insist that you never believe anything unless you check the data yourself. Well, please consider the fact that you can read these simple graphs with plotted trend lines showing a 30 year average being lower at the start than the end and conclude that the rainfall isn't increasing, and re-evaluate if you are qualified to make a judgement on these papers that contradict what the vast majority of trained experts in their field conclude
There is a trend upwards over the past at least the past 2 decades, but it will take decades to show whether that trend continues, or of it reverts back to the 20th century mean. The models suggest that the trend will continueBut wait, you said there IS a trend. Now you're saying we won't know for decades? Which is it?
Emotive, perhaps, but given the danger, I don't know if it's hyperbole.Don't worry, you speak enough emotive hyperbole for everyone!
Take this abstract from a recent paper called 'Nonlinear climate sensitivity and its implications for future greenhouse warming'
This is Science speak for 'Holy Sh1t, we're screwed!"Global mean surface temperatures are rising in response to anthropogenic greenhouse gas emissions. The magnitude of this warming at equilibrium for a given radiative forcing—referred to as specific equilibrium climate sensitivity (S)—is still subject to uncertainties. We estimate global mean temperature variations and S using a 784,000-year-long field reconstruction of sea surface temperatures and a transient paleoclimate model simulation. Our results reveal that S is strongly dependent on the climate background state, with significantly larger values attained during warm phases. Using the Representative Concentration Pathway 8.5 for future greenhouse radiative forcing, we find that the range of paleo-based estimates of Earth’s future warming by 2100 CE overlaps with the upper range of climate simulations conducted as part of the Coupled Model Intercomparison Project Phase 5 (CMIP5). Furthermore, we find that within the 21st century, global mean temperatures will very likely exceed maximum levels reconstructed for the last 784,000 years. On the basis of temperature data from eight glacial cycles, our results provide an independent validation of the magnitude of current CMIP5 warming projections.
It says that the warmer the climate gets, it becomes much more sensitive to greenhouse gasses, (which makes sense when we consider that the atmosphere holds more water vapour (a significant greenhouse gas), and the oceans can hold less CO2) so if we don't stop global warming early, we're gonna see temperature rises in accordance with the most pessimistic forecasts and catastrophic effects of global warming within the lifetimes of many people alive today.
It is a genuine emergency.
We need to do these things too. And these are more urgent in a world where these kinds of events happen more frequently.Or we should reduce the impacts of current events by not building on flood planes, by dredging rivers, increasing natural soakage and reducing artificial runoff.
The energy crisis is that we have too much oil, not that we don't have enough. There are 50 years of proven oil reserves left at the rate we currently burn it. On top of that, there is another trillion barrels of shale oil (low estimate) that would become viable to produce long before we have a major energy crisis and by then we'll have already have caused runaway global warming and the eventual collapse of civilisation as we know it. We need to move to renewable energy ASAP and we need to commit to leave most of the Oil Coal and Gas in the ground.We need to get away from fossil fuels because if we don't we will run into an energy crisis far more serious than any future climate change scenarios.
Come back to me when you've plotted the graph correctly showing the rolling 30 year trend for the series rather than just removing the bits of the graph that clearly show there is a long term trend and focusing on a bit that is ambiguous.Blatantly downward? As I said earlier, where is the trend before the past 2 decades? To help you see it I've removed both ends to show 1930-2000. Now, where are these blatant trends you speak of? Rainfall and PDSI falling? Nope. I see no response in either to the temperature trend. As I said, the past 2 decades show an abrupt change, but why not the early century warming or since 1970?
If you want to show early century warming, why did you remove the early century data from the graph. There might have been a flat period in the mid century (explainable by natural variability and the global dimming effect as industrial pollution reduced solar radiation reaching the surface) but the 100 year trend is for reduced rainfall, increased temperatures, and increased risk of drought. The past 30 years have seen dramatic increases in warming due to both global brightening (reduction of global dimming as we clean up our air quality) and global warming due to greenhouse gasses (the dominant effect as per the overwhelming consensus of scientists in the field)0 -
Maybe you've discovered an error made by Met Eireann in their analysis of their data, you should contact them to let them know.
Or maybe you're reading the data wrong. They all show an increase over the 30 years. The average rainfall at the beginning of the 30 years was lower than the average rainfall at the end of the graph for all 4 seasons. And the green line is the average of all years in that 30 year period.
Apologies, I was indeed reading it incorrectly. Got the two averages mixed up! Still, by how much have flash flood episodes increased?Emotive, perhaps, but given the danger, I don't know if it's hyperbole.
Take this abstract from a recent paper called 'Nonlinear climate sensitivity and its implications for future greenhouse warming'
This is Science speak for 'Holy Sh1t, we're screwed!"
It says that the warmer the climate gets, it becomes much more sensitive to greenhouse gasses, (which makes sense when we consider that the atmosphere holds more water vapour (a significant greenhouse gas), and the oceans can hold less CO2) so if we don't stop global warming early, we're gonna see temperature rises in accordance with the most pessimistic forecasts and catastrophic effects of global warming within the lifetimes of many people alive today.
It is a genuine emergency.
That is based on RPC 8.5, which is worst case scenario and on current observations nowhere near where we're heading. We're currently barely even keeping up with the RPC 4.5 projections, as I've shown previously: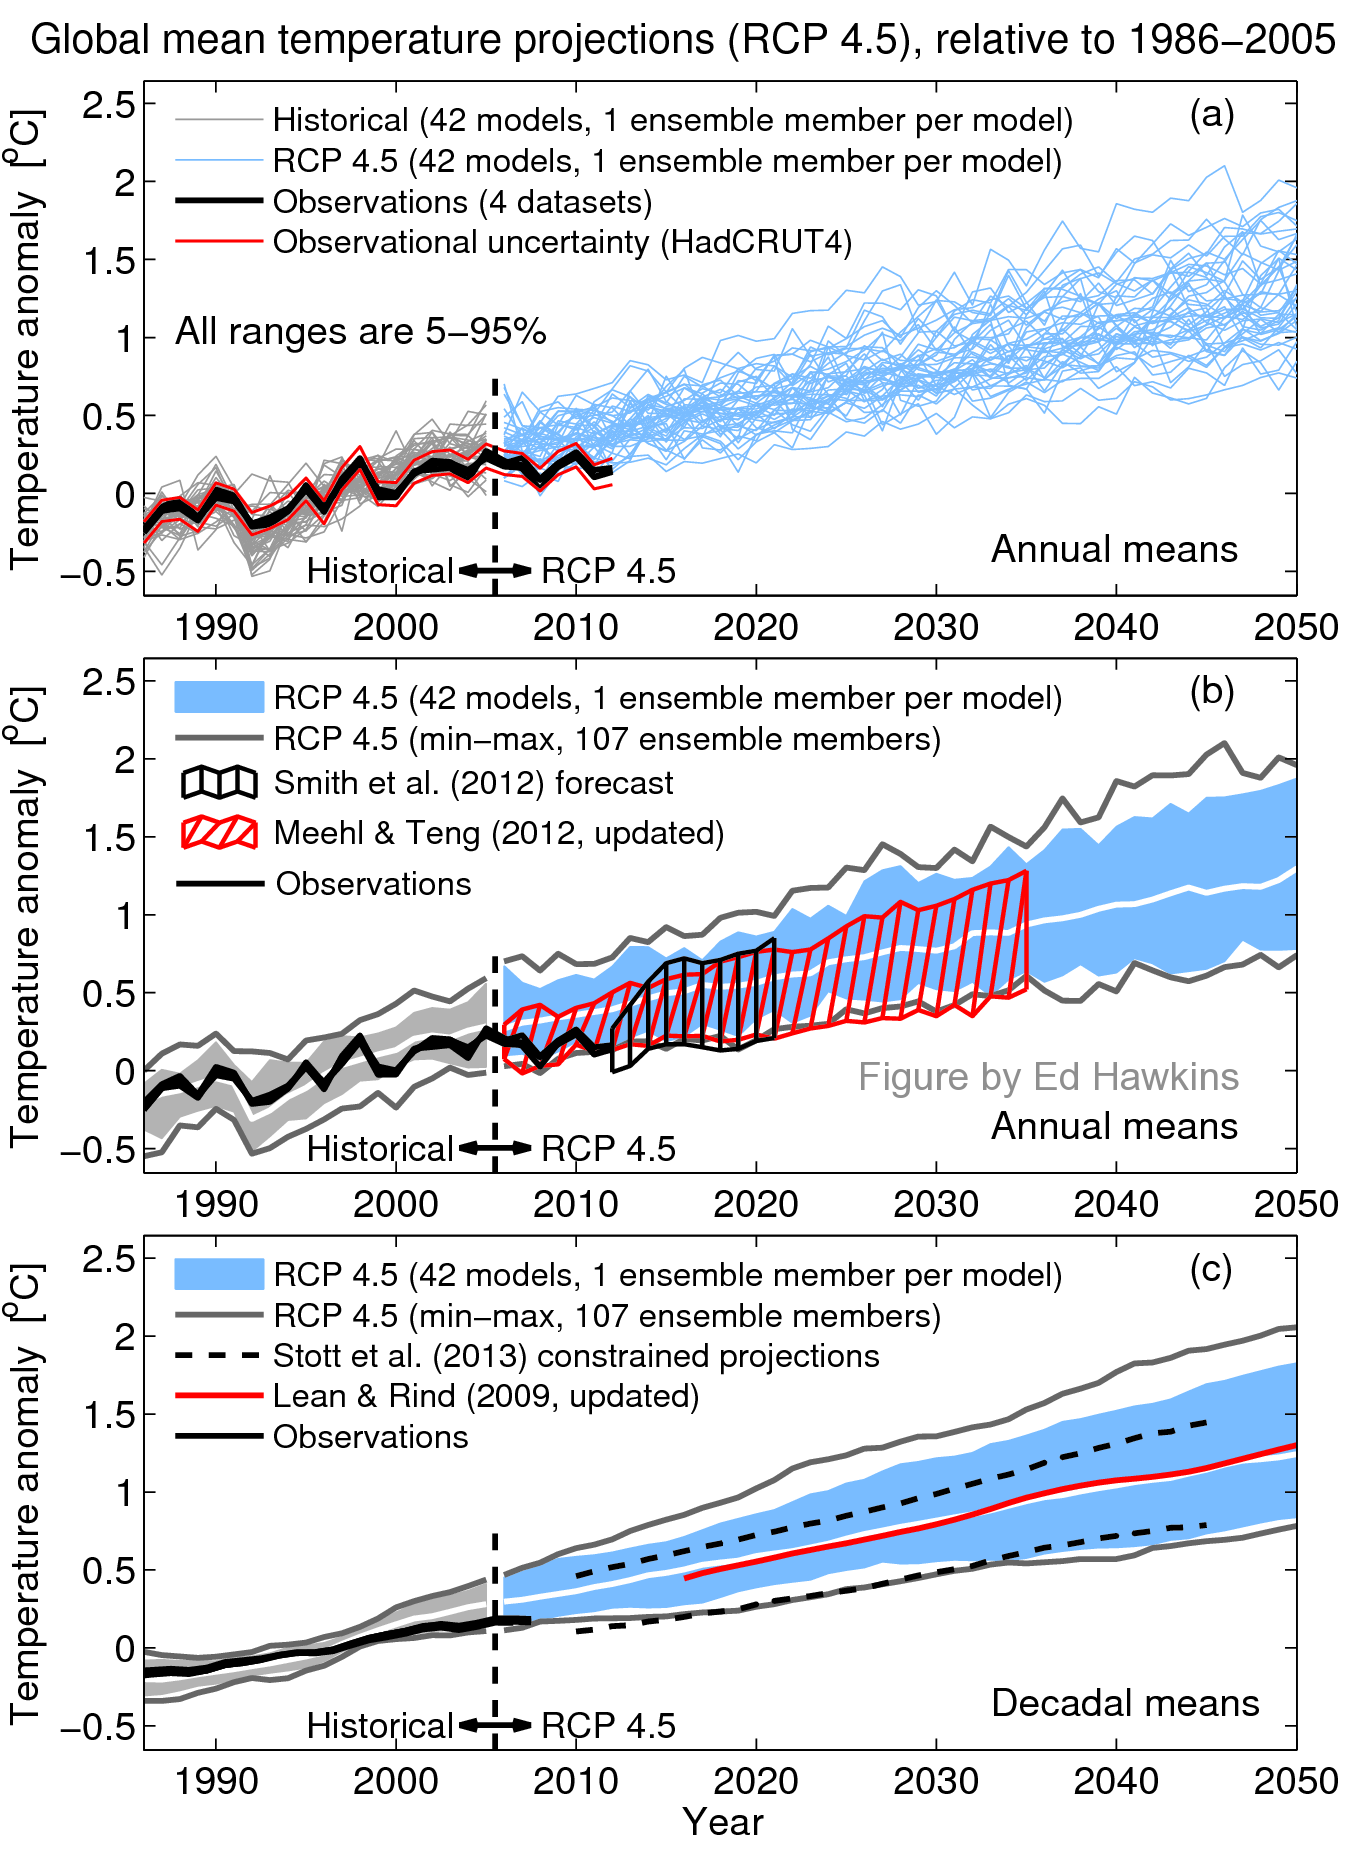 We need to do these things too. And these are more urgent in a world where these kinds of events happen more frequently.
The energy crisis is that we have too much oil, not that we don't have enough. There are 50 years of proven oil reserves left at the rate we currently burn it. On top of that, there is another trillion barrels of shale oil (low estimate) that would become viable to produce long before we have a major energy crisis and by then we'll have already have caused runaway global warming and the eventual collapse of civilisation as we know it. We need to move to renewable energy ASAP and we need to commit to leave most of the Oil Coal and Gas in the ground.
Please, quit the Daily Express-esque hyperbole. Civilisation will not end.Come back to me when you've plotted the graph correctly showing the rolling 30 year trend for the series rather than just removing the bits of the graph that clearly show there is a long term trend and focusing on a bit that is ambiguous.
If you want to show early century warming, why did you remove the early century data from the graph. There might have been a flat period in the mid century (explainable by natural variability and the global dimming effect as industrial pollution reduced solar radiation reaching the surface) but the 100 year trend is for reduced rainfall, increased temperatures, and increased risk of drought. The past 30 years have seen dramatic increases in warming due to both global brightening (reduction of global dimming as we clean up our air quality) and global warming due to greenhouse gasses (the dominant effect as per the overwhelming consensus of scientists in the field)
I left out the grey shaded timeline as the authors said it was an unreliable era due to poor coverage. Nevertheless, here it is included, for what it's worth, showing no drop in rainfall pre-1930 or indeed for the whole century. The only drop has been the past 20 years, which is included in the red trendline. 0
0 -
July sea ice volume bucked the trend and caused surprises
http://neven1.typepad.com/blog/2017/08/piomas-august-2017.htmlLast month I expected the trend line on the PIOMAS sea ice volume anomaly graph to leave the two standard deviation territory, but I was mistaken, as it has gone up instead of down:
Last year I was of the opinion that the Arctic (and thus the rest of the world) had dodged a bullet, thanks to a slow start of the melting season. This year I'd say it has dodged a cannonball given the record low maximum and the record low volume (by a large margin) for months on end. Not only was there a slow start in May, but also, when the sun started to make itself felt, a larger amount of winter snow on the ice seemed to block the formation of melt ponds. This meant that there's a lot less melting momentum than we saw in years like 2007, 2010 and 2012, which basically can make a big difference for thin ice right behind the periphery.
And right now cyclones still dominate the Arctic. They're quite benevolent, not as destructive as the Great Arctic Cyclones of 2012 and 2016 by far, but more like the persistent cyclones of 2013. The current weather forecast doesn't show much signs of this changing, and so it will be interesting to see whether 2017 is still in second place at the end of this month, or whether it will be overtaken by 2011 and possibly even 2016.
We'll know more in a couple of weeks.
Almost three weeks have passed since that was written and the ice extent continues to flatten out well above 2012. It will be interesting to see where this year finishes. 0
0 -
There isn't really good data for the statistics on Flash floods that I can find. It's difficult to attribute the causes of flooding when there are so many other factors, such as development, tides and land use that are factors in whether rivers burst their banks.Gaoth Laidir wrote: »Apologies, I was indeed reading it incorrectly. Got the two averages mixed up! Still, by how much have flash flood episodes increased?
But again, I'll retreat to the models. When models are controlled for other variables, there are more intense floods when climate change is factored in compared to atmospheric GHGs at pre-industrial levels.That is based on RPC 8.5, which is worst case scenario and on current observations nowhere near where we're heading. We're currently barely even keeping up with the RPC 4.5 projections, as I've shown previously:
RCP 8.5 refers to the radiative forcing that will happen if we don't reduce our emissions rapidly. The RCP calculations are based on the physics of how
much GHGs will affect the amount of energy the earth traps rather than radiates out into space due to the greenhouse effect. Climate sensitivity relates to how much temperatures will change as a result of changes in greenhouse emissions (sensitivity includes both positive and negative feedbacks like energy absorbed in the oceans and the melting of ice and effects on the biosphere)
Currently we are on the RCP 8.5 path. In order to be on the less dangerous paths, we should have been reducing our greenhouse emissions years ago
This particular study modeled climate going back through 6 glacial cycles, and they discovered that climate sensitivity is higher when temperatures are higher. So as we warm the planet, sensitivity increases in a non linear manner. So that even if it seems like climate sensitivity today is overstated, as temperatures increase, the sensitivity to these GHGs also increase to the point were we are likely to meet or even exceed the temperature increases predicted in the IPCC RCP 8.5 scenario.
(sorry, I thought I had included a link to the study in the last post, but here it is
http://advances.sciencemag.org/content/2/11/e1501923.full
)
The UK independent had this to say in November last yearPlease, quit the Daily Express-esque hyperbole. Civilisation will not end.
"Climate change may be escalating so fast it could be 'game over', scientists warn" which included the following quotes
“It sounds on the apocalyptic side of bad and, in some ways, it is realistic because ‘business as usual’ just got more likely as Trump wants to rebuild the pipelines … the complete ‘fossilisation’ of the US,” he said.
“It was game over at six [degrees] to be honest. I don’t think there was much more to add, other than turning the planet into Venus.”
http://www.independent.co.uk/news/science/climate-change-game-over-global-warming-climate-sensitivity-seven-degrees-a7407881.html
We'll have to agree to disagree there, without the rolling 30 year average plotted on the graph, it's a judgement call, but i still think these graphs show that the temperature and rainfall has been consistent with AGW throughout the whole 20th century.I left out the grey shaded timeline as the authors said it was an unreliable era due to poor coverage. Nevertheless, here it is included, for what it's worth, showing no drop in rainfall pre-1930 or indeed for the whole century. The only drop has been the past 20 years, which is included in the red trendline.0 -
RPC 4.5 has emissions maxing by 2040. My point was that temperature observations are barely tracking the bottom of the forecast range of that scenario. We may still be on the 8.5 emissions, which is what your graph shows, but even at that, the temperature is nowhere near where it should be on that.
On the other graph, yes, agree to disagree. Ypu seem to see rainfall falling off when it's clearly not.0 -
World problems don't seem so bad when you eat some salad.

New Moon
0 -
Nearing the Arctic minimum date now and the recovery this year has been notable. Extent, and volume and thickness will finish well back above 2012, 2015 and 2016.
http://neven1.typepad.com/blog/2017/09/piomas-september-2017.html#more
It seems my prayers from May have been heard:There's nothing else to do but hope that PIOMAS has it completely wrong, or else pray for lots of cold and cloudy weather in the Arctic this summer.Well, the weather did its thing and produced one of the biggest turnarounds
in the Arctic I have seen so far. I mean, in 2013 the ice managed to return from the brink of death, so to say, but at least the winter preceding it had been very cold. This year the melting season started with a record low volume after an incredibly mild winter.
One consequence of that mild winter, however, was lots of snowfall on the ice and adjacent land masses (see here). This snow likely managed to reflect some of the sunny weather that creates what I call melting momentum during May
and June. So, with snow melting out late and not much melting momentum to speak of (yet again), it all came down to what kind of weather we'd be seeing during July and August. Cue low pressure.
Also, the Greenland ice mass may show the first increase this century.
https://nsidc.org/greenland-today/2017/09/late-summer-melting-spike/Extensive and persistent melt in northern Greenland characterized late July to early August. A brief high pressure pattern entered on the west coast led to similar conditions that made 2015 a record melt year for the ice sheet’s northern sections. Overall, however, reduced melting and heavy early springtime snowfall may result in a net increase in Greenland’s ice mass this year for the first time this century.
 0
0 -
As we approach maximum Arctic Sea Ice, interesting to look at record low covering and effect of Sudden Stratospheric Warming and subsequent Arctic blocking on temperatures at 80 degrees latitude.
http://nsidc.org/arcticseaicenews/
https://nsidc.org/arcticseaicenews/charctic-interactive-sea-ice-graph/
http://ocean.dmi.dk/arctic/meant80n.uk.php0 -
From 2009 onwards is pretty shocking:
0 -
Advertisement

 https://www.youtube.com/watch?v=LQhX8PbNUWI


Advertisement