Advertisement
If you have a new account but are having problems posting or verifying your account, please email us on hello@boards.ie for help. Thanks :)
Hello all! Please ensure that you are posting a new thread or question in the appropriate forum. The Feedback forum is overwhelmed with questions that are having to be moved elsewhere. If you need help to verify your account contact hello@boards.ie
Largest ever Star "Age Map" traces galactic history
Options
-
12-01-2016 9:07pm#1
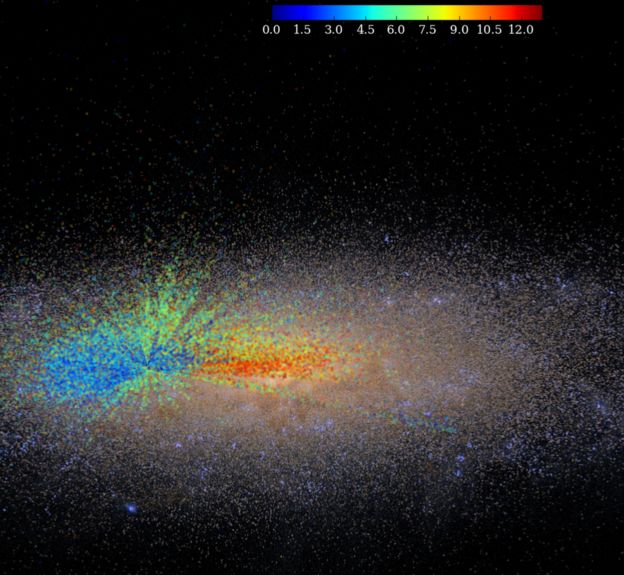
Red for old, blue for new: The colour scale at the top is in billions of years
Astronomers have measured the age of 70,000 stars across the Milky Way and put the results into a galactic map.
It confirms what was already suspected about our galaxy's growth: it started in the middle and grew outward.
How they did it...Firstly, the Apogee project - part of the ground-based Sloan Digital Sky Survey - sampled many thousands of stars, 300 at a time, using a wide swathe of wavelengths. These spectra help astronomers to work out the chemical composition of stars, but cannot determine their age directly.
So the team started with a subset of stars that had also been observed from space by the Kepler satellite. This telescope stares at a few stars for a long period of time, and can establish their mass.
"If we know the mass of these Kepler stars, we can determine their ages," Dr Ness explained. This enabled her team to build a model relating a star's mass and age to its colour spectrum, from the Apogee data.
That model could then be deployed to calculate ages for all the remaining stars, based purely on their spectra.
http://www.bbc.com/news/science-environment-352675712
Comments
-
That is fascinating work. The glossy summaries left me with a few questions, so I dug out the original papers, if anyone's interested. Here is the Ness et al.'s work from a year ago on developing The Cannon, a technique for characterising certain stellar properties (which they call labels) from the spectra of stars:
http://arxiv.org/abs/1501.07604
And here is their latest work published last week, which produces the stellar age map of the Milky Way:
http://arxiv.org/abs/1511.08204
The idea is that if you have a reference subset of stars for which certain target properties are known by independent means, you can use them as a training set. You then look at correlations between other properties on the training set, and by using these correlations as a proxy for the target properties, you then look for the same correlations among the larger sample of stars to infer the target properties.
Clear as mud? The best example with which to illustrate this is the actual work that Ness et al. have just produced last week using the previously developed Cannon. The spectrum of a star tells you about which elements are in the star's atmosphere, and their relative abundances. The relative abundances of certain elements give clues to the star's age and mass. Known physics about stellar evolution predict that a star of a given mass will evolve to the red giant stage after a certain amount of time.
Unfortunately, there is a complication. The rate of evolution is also affected by metallicity, that is, the amount of heavier elements that existed in the original gas cloud from which the star formed. As the whole galaxy evolves, the metallicity of the gas in its interstellar medium (ISM) increases as generations of dying stars scatter the heavier elements that they synthesise inside their cores. New stars form from the ISM and their rate of evolution is affected by the makeup of their birth material. But that makeup is something we don't know when we come to look at the stars later in their lives. Bear in mind that our relative abundance technique only works once the star has entered the red giant phase late in life when it's core temperature has risen dramatically, giving rise to strong convection plumes that "dredge up" the material we are interested in to the surface. At this stage of the star's life it may have drifted far from where it was born, so we can't rely on models of how metallicity varies with radius from the galactic centre.
So we have the problem that the elemental abundances in existing red giant stars cannot independently constrain both mass and age. If we only knew one parameter independently, we could infer the other from the relative abundances. Now, there is a way to determine the mass of a star by independent means, using a technique developed only recently (it might even have been reported here -- I remember reading about it here or elsewhere not too long ago). This technique has to do with astroseismology, which can be studied through variations in the surface brightness of stars. The timescale of variation is directly related to the mass of the star. It so happens that the Kepler mission has been studying surface brightness variations at great length and in minute detail for a whole different purpose -- to detect transiting exoplanets.
But now we have a set of observations from Kepler with mass determined by brightness variations, and we have spectra of the same stars from the Sloan Digital Sky Survey (SDSS). Various other properties of the stars can be measured directly from the SDSS spectra. This set of stars is used as a "training set", to learn how combinations of these other properties of the stars vary according to mass. To test the accuracy of the correlation, 10% of the training set is taken out, the model is trained using the other 90% and the masses of the 10% predicted using the directly measured properties. The predictions are then compared to the known masses from astroseismology. The test process is repeated using different 10% subsets.
Once the training step is done, the same techniques are used on a much larger set of SDSS spectra to infer the masses from the combinations of directly measured properties. Just by way of summary, the directly measured properties were:- Teff : this is the temperature of the surface of the star. It can be determined from the continuum level of the spectrum (that is, how the energy of the spectrum varies across different wavelengths)
- log g: this is a measure of the surface gravity of the star. The earth has a log g of 2.99, which is the base 10 log of the 981 cm/s/s gravitational acceleration at its surface. The sun has about 30 times earth's surface gravity but on red giants it could be thousands of times lower because they have swelled up to greater sizes and lower densities. Surface gravity causes so-called "pressure broadening" of absorption lines in the star's spectrum.
- [Fe/H]: This is the ratio of iron abundance to hydrogen abundance measured by the strength of the absorption lines in the spectrum due to those two elements.
- [α/Fe]: This is the ratio of α-elements to iron. These are elements that can be built up by the alpha (α) process inside stars. Stars make helium from hydrogen, and the triple-alpha process sticks three helium nuclei (also called alpha particles) together to make carbon. Successive additions of alphas make the heavier α-elements in sequence: carbon, oxygen, neon, magnesium, silicon, sulfur, argon, calcium, titanium, chromium, iron.
For me, a couple of questions remained about the study. They only looked at red giant stars (actually two types of red giant: "first ascent red giants" and "red clump" stars). These are stars at very specific stages of evolution. Most stars in a galaxy are much smaller than those which have reached the red giant stage. Smaller stars live longer, and some will live a hundred billion years -- much older than the current age of the galaxy. By measuring only red giants they are assuming that they are representative of the distribution of stellar ages.
I also couldn't see from the star map that the galaxy evolves "from the centre out". Yes it's older at the centre, but looks more uniform further out. I thought the arms of spiral galaxies were due to density waves which trigger collapse of the ISM and produce lots of O and B stars, hence their blueness and young age. Are we sure there isn't just two populations -- central nucleus and spiral arms, without dramatic age variance with radius across the arms?
Just my random musings. :pac:0 -
Genie, you tore into that PS. Arxiv is not peer reviewed, though you'd have to wonder sometimes if it matters anymore.
Your red giant question seems a good one, all over my head though...0


Advertisement