Advertisement
If you have a new account but are having problems posting or verifying your account, please email us on hello@boards.ie for help. Thanks :)
Hello all! Please ensure that you are posting a new thread or question in the appropriate forum. The Feedback forum is overwhelmed with questions that are having to be moved elsewhere. If you need help to verify your account contact hello@boards.ie
Climate Change - General Discussion : Read the Mod Note in post #1 before posting
Options
Comments
-
According to the linked study it did kill 70k people, other sources have the figure lower, all the sources I have seen attribute deaths in the tens of thousands.Gaoth Laidir wrote: »Stop. Just stop. I can't read any more of your nonsense.
a) 2003 is not attributable to agw, and it most certainly did not kill 70,000 people. It was a once-off warm summer that hasn't been repeated since.
And not repeated?
There were extreme heatwaves in Europe in 2006
https://en.wikipedia.org/wiki/2006_European_heat_wave
2007 https://en.wikipedia.org/wiki/2007_European_heat_wave
2015 https://www.rte.ie/news/2015/0703/712435-heatwave-europe/
2016 https://www.theguardian.com/uk-news/2016/sep/13/uks-hottest-september-day-since-1949-32c-heathrow
2017 https://en.wikipedia.org/wiki/2017_Southern_Europe_heat_wave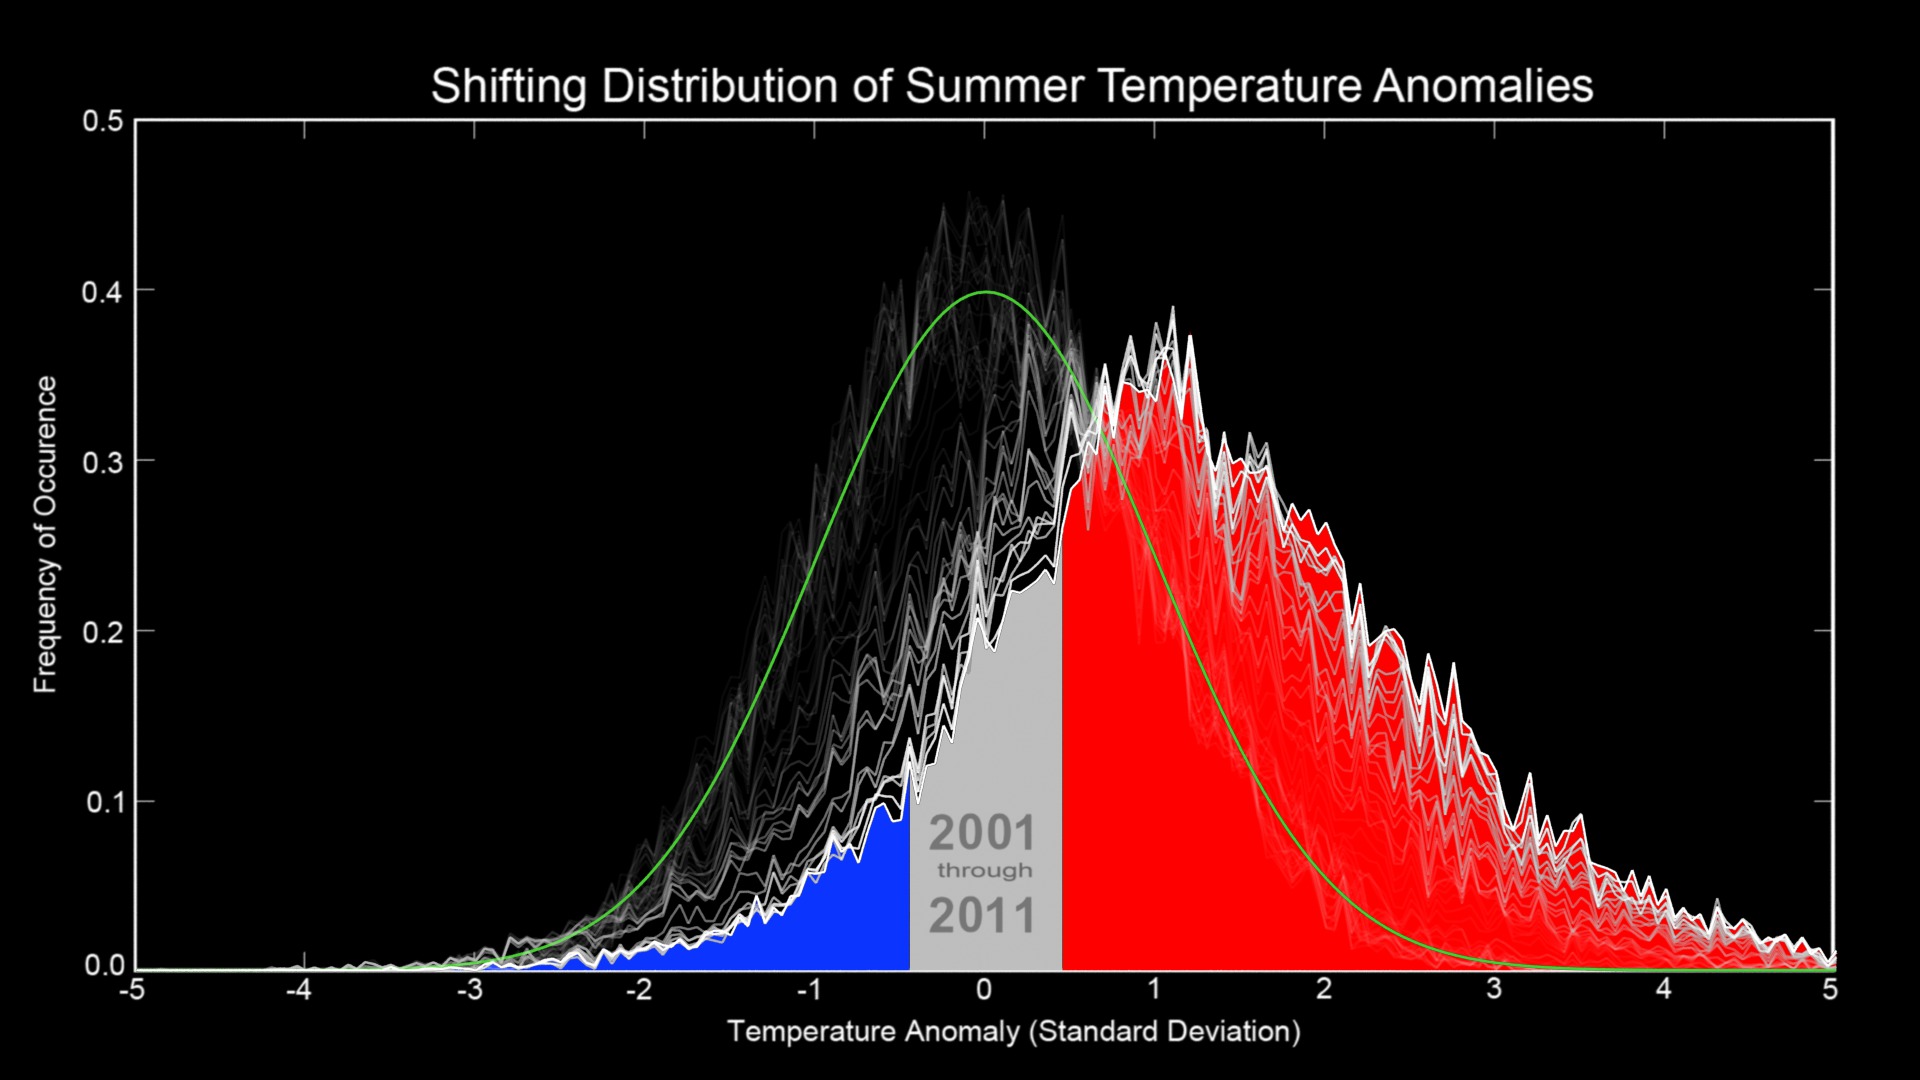
Was it caused by global warming? Its severity was worse than it would have been without climate change, and a 2017 study attributed 70% of Paris deaths to climate change
http://iopscience.iop.org/article/10.1088/1748-9326/11/7/074006
You need to go back and read what I said.b) You say "we" should reduce our emissions quickly, yet you are reluctant to do so as you're not getting a financial incentive to do so. "Do as I say, not as I do".
50c in places like southern France that have never experienced anything like 50c temperatures in the pastc) 50 °C by 2100 is such a general statement. 50 degrees where? Seville? Stockholm? Some cities have always had heatwaves up to near 50 degrees, so where exactly do you mean? The south of Spain gets this type of heat almost every year. Some of your statements look like they came from the desk of Nathan Rao.
]http://iopscience.iop.org/article/10.1088/1748-9326/aa751c/meta
By 2100, the increase in summer temperature maxima exhibits a range from 6 °C to almost 13 °C in the five regions in France, relative to historical maxima. These projections are comparable with the estimates given by a large number of global climate models.
You don't accept the evidence, but there is plenty of evidence to attribute climate change as a factor in the power of these storms.d) Puerto Rico? Houston? What's that got to do with agw? Again you're conveniently attributing two topical hurricanes as evidence of agw when in fact there is no proof whatsoever.
https://www.ucsusa.org/global-warming/science-and-impacts/impacts/hurricanes-and-climate-change.html
Storms are part of the mechanisms that help atolls to growe) Which storms would these be? Did you make them up too?It found factors such as wave patterns and sediment dumped by storms could offset the erosion caused by rising water levels.
Read more at: https://phys.org/news/2018-02-pacific-nation-bigger.html#jCpYour posts are becoming comical at this stage but with a background hint of hypocritical arrogance. Plus the deliberate insertion of words like "purely" to try to misrepresent what others said.
Your posts are getting angrier Gaoth. You need to take a chill pill and cool it with the name calling and accusations that I'm lying and making things up.
You are the one on the wrong side of the science here, not me.0 -
those graphs show the opposite of a levelling off over the past 20 years.Gaoth Laidir wrote: »Just on the Greenland ice melt, there's been significant levelling off of the rising trend of over the past 20 years relative to through the '80s and '90s.
https://nsidc.org/greenland-today/0 -
those graphs show the opposite of a levelling off over the past 20 years.
1979-1996: Slope = 1.074/decade
1997-2017: Slope = 0.343/decade (just 32% of the 1979-1996 rate, including the 2012 outlier. If 2012 was 3.0 the slope would be 0.226/decade, just 21% of the early rate.
But even with 2012, it still constitutes a threefold levelling off, as I said.0 -
You need to go back and read what I said.
50c in places like southern France that have never experienced anything like 50c temperatures in the past
Your posts are getting angrier Gaoth. You need to take a chill pill and cool it with the name calling and accusations that I'm lying and making things up.
You are the one on the wrong side of the science here, not me.
From the study that you found 50° in, which you are promoting here with some certainty:Results indicate that record maximum value in France could easily exceed 50 °C by the end of the 21st century.
These extreme temperatures are experienced in desert regions, which question how realistic such projected extreme temperatures could be in France.
You may just need to reassess how you're reading these studies?
http://iopscience.iop.org/article/10.1088/1748-9326/aa751c/meta0 -
From the study that you found 50° in, which you are promoting here with some certainty:
You may just need to reassess how you're reading these studies?
http://iopscience.iop.org/article/10.1088/1748-9326/aa751c/meta
And of course it's only based on RPC8.5, the worst-case scenario of all. This, of course, was not mentioned earlier.0 -
Advertisement
-
Join Date:Posts: 11803
Mod Note: Posters are requested to stop trading personal digs and insults. Difference of opinions need to be respected without attacking others for having different views.0 -
Gaoth Laidir wrote: »1979-1996: Slope = 1.074/decade
1997-2017: Slope = 0.343/decade (just 32% of the 1979-1996 rate, including the 2012 outlier. If 2012 was 3.0 the slope would be 0.226/decade, just 21% of the early rate.
But even with 2012, it still constitutes a threefold levelling off, as I said.
How are you calculating the slope?0 -
Gaoth Laidir wrote: »And of course it's only based on RPC8.5, the worst-case scenario of all. This, of course, was not mentioned earlier.
RCP 8.5 is an emissions scenario where humans continue to emit ghgs without concerted government policy action to prevent them. It includes some technological advancements and migration from fossil fuels as the new technology matures.
Isn't this the scenario you think we should be on? (more or less, with perhaps some disagreements on things like population growth allowable)
All the other scenarios involve deliberately cutting our emissions at different rates0 -
-
I know everyone has biases, but on this issue, I try to go based on the best scientific evidence I can find.
i think the bigger point here is why such a bias exists and what this bias is rooted in.The very fact that some, like yourself, go with 'the science' on this issue, and equally, why many contest it, suggests there are bigger forces at play in this whole debate. (in general, not just on here)New Moon
0 -
Advertisement
-
RCP 8.5 is an emissions scenario where humans continue to emit ghgs without concerted government policy action to prevent them. It includes some technological advancements and migration from fossil fuels as the new technology matures.
Isn't this the scenario you think we should be on? (more or less, with perhaps some disagreements on things like population growth allowable)
All the other scenarios involve deliberately cutting our emissions at different rates
Of course 8.5 is the one you should be on if you want to maximise the story, but it gets back to question of sensitivity and observations, which is increasingly making 8.5 look more unlikely.
What studies do you have on that same topic but with the other RCPs?0 -
According to the linked study it did kill 70k people, other sources have the figure lower, all the sources I have seen attribute deaths in the tens of thousands.
And not repeated?
There were extreme heatwaves in Europe in 2006.
No, 2003 has not been repeated. Heatwaves in Europe are a common fact of life. None has been as bad as 2003.Was it caused by global warming? Its severity was worse than it would have been without climate change, and a 2017 study attributed 70% of Paris deaths to climate change
http://iopscience.iop.org/article/10.1088/1748-9326/11/7/074006
And a lot of the deaths in Paris were attributed to poor methods of dealing with heat (air con, etc.) which is unlikely to be repeated. So if you want to talk about deaths (of course you do) then let's look at all the factors.You don't accept the evidence, but there is plenty of evidence to attribute climate change as a factor in the power of these storms.
https://www.ucsusa.org/global-warming/science-and-impacts/impacts/hurricanes-and-climate-change.html
And Landsea has shown that the number of severe hurricanes has actually been on the decline in the past few decades. I've posted the link several times before.Storms are part of the mechanisms that help atolls to grow
But where were these storms when the projections of inundation doom for these islands were being communicated? Are they just new storms that have only recently started growing the atolls so can explain away these failed forecasts?Your posts are getting angrier Gaoth. You need to take a chill pill and cool it with the name calling and accusations that I'm lying and making things up.
You are the one on the wrong side of the science here, not me.
Sorry, but you're the one who deliberately misrepresented what I said, so maybe have a think yourself at how you go about things.
Not sure what you mean by the wrong side of the science but only time will tell.0 -
Gaoth Laidir wrote: »In Excel, using the data of both periods.
Its a very odd measurement to choose. Most people use a moving average rather than a slope, which is ripe for cherry picking
Here is the 20 year moving average of those data (your choice of time period), and a 4 year moving average for a more smooth curve.
The graph shows a a steadily increasing trend in the number of melt area, which is represented in square km, which in reality means an accelerating rate of ice loss in Greenland0 -
Gaoth Laidir wrote: »Of course 8.5 is the one you should be on if you want to maximise the story, but it gets back to question of sensitivity and observations, which is increasingly making 8.5 look more unlikely.
What studies do you have on that same topic but with the other RCPs?
8.5 is the scenario you use when addressing the need for action on climate change. The other RCP scenarios relate to how much action we need to take. The lowest RCP, 2.6 is defunct now, there isn't a hope in hell we'll be able to meet that now, both rcp 4.5 and rcp 6 both require immediate action on climate change, they're just different scenarios for how quickly we're able to reduce our CO2 emissions.
RCPs don't deal with climate sensitivity, they only deal with radiative forcing. Studies can use the RCP 8.5 along with a lower estimate for climate sensitivity or a higher one. This is probably why the study I used gave a range for heatwaves between 6c an 13c above current maxima. That's a very big range because there is a large uncertainty, but note, even the lowest in that range is a disaster. Imagine if even the mid range came to pass, heatwaves of 54c in France.0 -
Look at my bell curve graph. What used to be an extreme heatwave heatwave is becoming a routine one, and the next extreme heatwave will be another record breaking one.Gaoth Laidir wrote: »No, 2003 has not been repeated. Heatwaves in Europe are a common fact of life. None has been as bad as 2003
I don't want to talk about deaths, they're just an indicator.And a lot of the deaths in Paris were attributed to poor methods of dealing with heat (air con, etc.) which is unlikely to be repeated. So if you want to talk about deaths (of course you do) then let's look at all the factors.
If you want to look at all the factors, why not start with wildlife and ecology. Humans can get air conditioning, wildlife, native flora and fauna cannot survive heatwaves of this magnitude if they happen regularly.
In line with the model predictions of fewer, but more extreme hurricanes and typhoons.And Landsea has shown that the number of severe hurricanes has actually been on the decline in the past few decades. I've posted the link several times before.
There are storms all the time, it's normal. The projections were based on the sea level rises which are happening without taking into account the rate of deposition on the atolls.But where were these storms when the projections of inundation doom for these islands were being communicated? Are they just new storms that have only recently started growing the atolls so can explain away these failed forecasts?
These islands are still at risk. Just because there is sand deposited on the edges doesn't mean the inhabitants can live on them, and the predictions were for them to be fully inundated a hundred years from now.
Sea level rises are still a threat to hundreds of millions of people. 'skeptics' might have sandier beaches in Tuvalu, but that won't help the people of Bangladesh or Florida or countless other low lying regions.Sorry, but you're the one who deliberately misrepresented what I said, so maybe have a think yourself at how you go about things.
Not sure what you mean by the wrong side of the science but only time will tell.
I mean more than 97% of published peer reviewed science agrees that climate change is a serious threat that needs to be addressed, and very few actively publishing scientists share your view that climate change is being over hyped and we can afford to carry on business as usual.0 -
Its a very odd measurement to choose. Most people use a moving average rather than a slope, which is ripe for cherry picking
Here is the 20 year moving average of those data (your choice of time period), and a 4 year moving average for a more smooth curve.
The graph shows a a steadily increasing trend in the number of melt area, which is represented in square km, which in reality means an accelerating rate of ice loss in Greenland
Your own data are showing a levelling off over the past decade. How can you say it's accelerating?0 -
I mean more than 97% of published peer reviewed science agrees that climate change is a serious threat that needs to be addressed, and very few actively publishing scientists share your view that climate change is being over hyped and we can afford to carry on business as usual.
Do you have a source for this latest 97% figure?
It's like a new twist on the old "97% of scientists" claim, which was shown to be false.
Where is the project which undertook a review of 100% of "published peer reviewed science" and deduced that 97% of published science "agrees that climate change is a serious threat that needs to be addressed"?
If you have it to hand I'll take a look.0 -
Look at my bell curve graph. What used to be an extreme heatwave heatwave is becoming a routine one, and the next extreme heatwave will be another record breaking one.
As I said, 2003 hasn't been repeated. Are you sure the next one will be record-breaking?I don't want to talk about deaths, they're just an indicator.
Yes you do, you brought up the topic of deaths in 2003.If you want to look at all the factors, why not start with wildlife and ecology. Humans can get air conditioning, wildlife, native flora and fauna cannot survive heatwaves of this magnitude if they happen regularly.
Such as?In line with the model predictions of fewer, but more extreme hurricanes and typhoons.
Look up Klotzbach & Landsea (2015).Small, insignificant decreasing trends are present in category 4–5 hurricane frequency in the Northern Hemisphere and globally, while there is no virtually no trend in Southern Hemisphere frequency.
Small, insignificant upward trends are present in category 4–5 hurricane percentage in the Northern Hemisphere, the Southern Hemisphere, and globally.
Large, significant downward trends are present in accumulated cyclone energy in the Northern Hemisphere, the Southern Hemisphere, and globally.
These results provide more evidence that the changes reported by Webster et al. (2005) that occurred in number and percentages of category 4–5 hurricanes globally during the 1970s and 1980s were likely primarily due to improved observational capabilities. These results are more in line with expectations from climate models (Knutson et al. 2010, 2013; Camargo 2013; Christensen et al. 2013; Bender et al. 2010), which suggest that no appreciable change in category 4–5 hurricane numbers or percentages would be detectable at this time due to anthropogenic climate change.
Because of the additional evidence provided here about the artificial impacts of technology on the best-track databases, it is recommended that global studies addressing trends in extreme hurricanes (as well as combined metrics like ACE) begin around 1990. Before this time, the records are currently incomplete and lead to a distorted view of the actual activity that occurred before that time. We would also encourage the further development and extension backward in time of satellite-only homogeneous databases (Kossin et al. 2013) suitable for trend analysis.There are storms all the time, it's normal. The projections were based on the sea level rises which are happening without taking into account the rate of deposition on the atolls.
These islands are still at risk. Just because there is sand deposited on the edges doesn't mean the inhabitants can live on them, and the predictions were for them to be fully inundated a hundred years from now.
Sea level rises are still a threat to hundreds of millions of people. 'skeptics' might have sandier beaches in Tuvalu, but that won't help the people of Bangladesh or Florida or countless other low lying regions.
As I've said before, if places like Florida are prone to danger, why are they prime real estate?I mean more than 97% of published peer reviewed science agrees that climate change is a serious threat that needs to be addressed, and very few actively publishing scientists share your view that climate change is being over hyped and we can afford to carry on business as usual.
I never said carry on business as usual. There you go misquoting me again. I've always said we need to get off fossil fuels. However, if we don't I don't believe the hype that you like to portray.0 -
Speaking of March, I didn't see this info on the very cold European March posted and retweeted anywhere, like we see when a month is anomalously warm.
http://surfobs.climate.copernicus.eu//stateoftheclimate/march2018.php
 0
0 -
Gaoth Laidir wrote: »Speaking of March, I didn't see this info on the very cold European March posted and retweeted anywhere, like we see when a month is anomalously warm.
February was also cooler than average over the greater European region, but just having a quick skeg over the average monthly anomaly since January 2017 (and up to April 2018) it comes in at 0.78c. I might do a more intensive look back later, but overall, I think cold months over Europe are becoming less frequent overall, but we'll see.New Moon
0 -
Advertisement
-
It's almost by definition when you have a shifting of the bell curve as i posted above. 2003 hasn't been surpassed yet, but several of the recent heatwaves have been close to the intensity of 2003 because normal heatwaves are now on the verge of what used to be an extreme heatwave. In the future, 2003 levels of temperature will be seen as normal, so the new extreme heatwaves will be. the 2010 Russian heatwave was worse than the 2003 one and killed killed tens of thousands of people too, but it wasn't affecting the same areas as the 2003 one so its not directly comparableGaoth Laidir wrote: »As I said, 2003 hasn't been repeated. Are you sure the next one will be record-breaking?
In this study looking at european heatwaves in the 64 year period between 1950 and 2014, 6 of the top 10 heatwaves occured in the 11 year period between 2003 and 2014. In Central Europe, the top 3 heatwaves have all been this in this period.
http://iopscience.iop.org/article/10.1088/1748-9326/10/12/124003/pdf
only in response to someone saying that these events are not serious.Yes you do, you brought up the topic of deaths in 2003.
There are a multitude of studies and reports showing that flora and fauna are being affected by climate changeSuch as?https://www.eea.europa.eu/data-and-maps/indicators/distribution-of-plant-species-2/assessmentKey messages
Observed climate change is having significant impacts on the distribution of European flora and fauna, with distribution changes of several hundred kilometres projected over the 21st century. These impacts include northwards and uphill range shifts, as well as local and regional extinctions of species.
The migration of many species is lagging behind the changes in climate owing to intrinsic limitations, habitat use and fragmentation, and other obstacles, suggesting that they are unable to keep pace with the speed of climate change. Observed and modelled differences between actual and required migration rates may lead to a progressive decline in European biodiversity.
Climate change is likely to exacerbate the problem of invasive species in Europe. As climatic conditions change, some locations may become more favourable to previously harmless alien species, which then become invasive and have negative impacts on their new environments.
Climate change is affecting the interaction of species that depend on each other for food or other reasons. It can disrupt established interactions but also generate novel ones.
I'll read that later when I have more timeLook up Klotzbach & Landsea (2015).
Probably for similar reasons that people live near active volcanos and on active fault-lines prone to earthquakes.As I've said before, if places like Florida are prone to danger, why are they prime real estate?
The business as usual 8.5 scenario includes some transition from fossil fuels but without government intervention preventing fossil fuel companies from extracting all their reserves.I never said carry on business as usual. There you go misquoting me again. I've always said we need to get off fossil fuels. However, if we don't I don't believe the hype that you like to portray.0 -
Why do you think this is worth posting? Do you think it contradicts climate change somehow? Or do you want to discuss the reasons why you think Europe had a significantly cold March.Gaoth Laidir wrote: »Speaking of March, I didn't see this info on the very cold European March posted and retweeted anywhere, like we see when a month is anomalously warm.
http://surfobs.climate.copernicus.eu//stateoftheclimate/march2018.php
Do you think there is a possible explanation that is compatible with climate change?0 -
It seems clear to me why he posted that. He explains it clearly. Anomalous warm periods become senesational headlines linked to climate change. The same is not true of cold periords which are quickly explained away as merely a side-effect of agw. Discuss.0
-
Keeping it local for the time-being, this chart shows the monthly 'IMT'* temperature anomaly since January 2011 up to April this year:

(Data from Met Éireann and deviations are in respect of the 1961-1990 average)
Over this period, the average monthly anomaly is running at +0.53 deg.C, which is no surprise, given how warmer than average months outweigh cooler months by a considerable degree, both in terms of frequency and intensity. However, how much can this be attributed to AGW? and how much is this anomaly down to the current state of the 'AMO', which continues to run in a positive state? One curious fact is that when Atlantic sea temps were running at their lowest in quite some time back in 2015, that we saw the highest consecutive number of cooler than average months here in Ireland in the series above. I will do a study on European temps later to see if there is any correlation with the data above.
*IMT is an Ireland temperature index, based on 5 inland met eireann stations, used M.T Cranium on his monthly competition thread. The data above uses 11, which not only includes data from the original 5 station, but also incorporates data from a select number of coastal stations.New Moon
0 -
It's almost by definition when you have a shifting of the bell curve as i posted above. 2003 hasn't been surpassed yet, but several of the recent heatwaves have been close to the intensity of 2003 because normal heatwaves are now on the verge of what used to be an extreme heatwave. In the future, 2003 levels of temperature will be seen as normal, so the new extreme heatwaves will be. the 2010 Russian heatwave was worse than the 2003 one and killed killed tens of thousands of people too, but it wasn't affecting the same areas as the 2003 one so its not directly comparable
In this study looking at european heatwaves in the 64 year period between 1950 and 2014, 6 of the top 10 heatwaves occured in the 11 year period between 2003 and 2014. In Central Europe, the top 3 heatwaves have all been this in this period.
http://iopscience.iop.org/article/10.1088/1748-9326/10/12/124003/pdf
Thanks for finally conceding that neither 2003 has been repeated nor that you're sure that the next heatwave will be record-breaking.only in response to someone saying that these events are not serious.
Thanks for conceeding that you did, in fact, bring it up.There are a multitude of studies and reports showing that flora and fauna are being affected by climate change
That shows projected impacts, not already-occurred ones.I'll read that later when I have more time
Do that, but the pertinent findings I've already quoted.Probably for similar reasons that people live near active volcanos and on active fault-lines prone to earthquakes.
Yes, it's the same thing. If people want to take a chance then it's up to them. It's no one else's fault.The business as usual 8.5 scenario includes some transition from fossil fuels but without government intervention preventing fossil fuel companies from extracting all their reserves.
I'll take that as a no then.0 -
Why do you think this is worth posting? Do you think it contradicts climate change somehow? Or do you want to discuss the reasons why you think Europe had a significantly cold March.
Do you think there is a possible explanation that is compatible with climate change?
Why is it worth posting when a month is a warmer than average? The fact that you're questioning my posting it is the very reason that I posted it, as I already explained.0 -
Neither of those are concessions because I never said either of those things. You're arguing against what you think I'm saying and missing my points entirely. You have avoided replying to any of my mentions of the bell curve. Is there a reason for this?Gaoth Laidir wrote: »Thanks for finally conceding that neither 2003 has been repeated nor that you're sure that the next heatwave will be record-breaking.
Conceeding? You said "you want to talk about deaths (of course you do)"Thanks for conceeding that you did, in fact, bring it up.
Which was your own smarmy way of suggesting I enjoy talking about deaths.
What does the word 'observed' mean then?That shows projected impacts, not already-occurred ones.
Findings are only pertinent if the methods are sound, and we should consider the broader scientific literature as well as the findings of individual papers.Do that, but the pertinent findings I've already quoted.
It is if we have chosen to not take measures to protect them. If San Francisco didn't have building regulations requiring earthquake resistance then it would be the governments fault if people get needlessly killed in a collapsed shopping centreYes, it's the same thing. If people want to take a chance then it's up to them. It's no one else's fault.
Right so you do support global action equivalent to spending at least 3 trillion dollars every year on action to prevent climate change?I'll take that as a no then.
Why didn't you say so earlier!
Would have saved a lot of hassle0 -
Gaoth Laidir wrote: »Why is it worth posting when a month is a warmer than average? The fact that you're questioning my posting it is the very reason that I posted it, as I already explained.
Because you choose to show Europe being colder than average, but not mention that globally march was still significantly warmer than average. And all weather is now affected by the changes we have made. The likelihood of atmospheric blocking in winter is affected by Atlantic ssts, and in summer by arctic amplification
The head of the WMO said last year that we are in uncharted territory. Climate change is affecting all aspects of global weather systems0 -
It is if we have chosen to not take measures to protect them. If San Francisco didn't have building regulations requiring earthquake resistance then it would be the governments fault if people get needlessly killed in a collapsed shopping centre.
Can you please stop saying we? It's grating. Why not just say they?
It's like when you said we discovered the satellites were wonky, remember?
We didn't discover it, they did.
We shouldnt be trying to ingratiate ourselves in these things, do you agree?
Whether it's a San Francisco shopping centre, or Florida real estate it's not incumbent upon us to protect them.
This constant, deliberately loose wording is poisoning the well.0 -
Advertisement
-
Cold periods need to be explained with reference to the weather systems that generate them. Climate change is real, therefore all weather is affected. We need to investigate how the atmosphere and oceans are interacting under this new warmer regime to better explain how weather will be affected. Posting a picture of a cold Europe and just letting it hang there serves no purpose.It seems clear to me why he posted that. He explains it clearly. Anomalous warm periods become senesational headlines linked to climate change. The same is not true of cold periords which are quickly explained away as merely a side-effect of agw. Discuss.
If I post a chart showing the global average temperature is yet again way above average, it is to show that climate change is still happening and the rate of warming. If Gaoth Laidir puts a chart showing one part of the world is colder than average, what is his point?0


Advertisement