Advertisement
If you have a new account but are having problems posting or verifying your account, please email us on hello@boards.ie for help. Thanks :)
Hello all! Please ensure that you are posting a new thread or question in the appropriate forum. The Feedback forum is overwhelmed with questions that are having to be moved elsewhere. If you need help to verify your account contact hello@boards.ie
Hi there,
There is an issue with role permissions that is being worked on at the moment.
If you are having trouble with access or permissions on regional forums please post here to get access: https://www.boards.ie/discussion/2058365403/you-do-not-have-permission-for-that#latest

CC3 -- Why I believe that a third option is needed for climate change

1131416181956

Comments

  • Registered Users, Registered Users 2 Posts: 216 ✭✭posidonia


    Did you see that second video I've been talking about? I'm having trouble getting an answer on the adjusted data, so maybe you'd be good enough to provide one. That is, if you've watched them...which I'm willing to bet you haven't.


    No, I haven't, but I wasn't replying to your post and I would watch the videos if I were going to reply to them :)


  • Registered Users, Registered Users 2 Posts: 8,221 ✭✭✭Gaoth Laidir


    MiNdGaM3 wrote: »
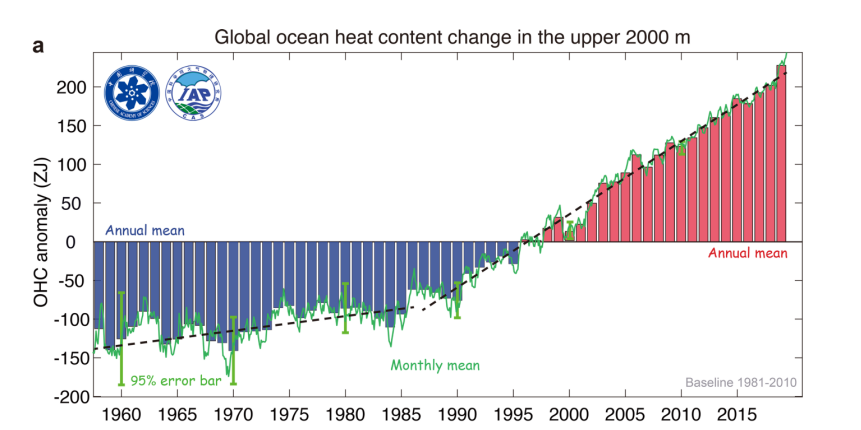
    It's from the original article that sparked this whole thing, a few pages back. Yesterday, you literally quoted my post where I mentioned the four and a half times increase since 1987. You then posted a link to the 2003 NASA study as proof it's the sun (for some reason).

    The article: https://www.theguardian.com/environment/2020/jan/13/ocean-temperatures-hit-record-high-as-rate-of-heating-accelerates
    The paper it's based on: https://link.springer.com/content/pdf/10.1007/s00376-020-9283-7.pdf

    ohc_cheng.png

    Sea surface temperatures are a different matter and requires much less energy than heating the upper 2,000m of water.
    Lining up one squiggle with another, shifting them about and claiming some kind of lag isn't really the best way to go about things. For one, there are many processes that affect SSTs. Secondly, you need a plausible physical mechanism for why there's this quasi-10-50 year lag. Really, ignoring any physical mechanisms and using variable lags you can fit almost anything to anything.

    You used the term accelerating over the past few decades. Maybe you meant something else, but the rate is not accelerating. There was an increase alright 35 years ago but the rate has been linear since then. Pedantic, maybe, but in science it's crucial.

    There is a lot we don't know yet about the oceans, but from what we do know it is entirely within the realms of possibility that the lag can come from decadal overturning, multidecadal natural variability, such as AMO, PDO, etc., and of course ENSO on shorter timescales. To outright eliminate the very fundamental force of global climate as having no effect over a century of increased levels is just ridiculous.


  • Registered Users, Registered Users 2 Posts: 1,176 ✭✭✭Longing


    People here attack the messenger (Tony Heller) not the message he speaks. When you see that it usually means one thing.
    ?s=fatherted&e=S03E05&i=S03E05-XXcw5p0J&t1=You%27re%20Clutching%20at%20straws&t2=Now%20what%20about%20the%20data!


  • Registered Users, Registered Users 2 Posts: 216 ✭✭posidonia


    Longing wrote: »
    People here attack the messenger (Tony Heller) not the message he speaks. When you see that it usually means one thing.


    Yes, you're exactly right!


    So when people like Tony Heller bandy words like liars, fraud and scam about I immediately think 'You're clutching at straws, now what about you look at the quality controlled climate data'. Heller attacks the messengers.


  • Registered Users, Registered Users 2 Posts: 8,221 ✭✭✭Gaoth Laidir


    posidonia wrote: »
    Yes, you're exactly right!


    So when people like Tony Heller bandy words like liars, fraud and scam about I immediately think 'You're clutching at straws, now what about you look at the quality controlled climate data'. He attacks the messengers.

    Go and look at the videos and see for yourself. :rolleyes:


  • Advertisement
  • Registered Users, Registered Users 2 Posts: 216 ✭✭posidonia


    Go and look at the videos and see for yourself. :rolleyes:
    Sorry, again, I wasn't replying to you. I know, for a fact*, Heller uses and has used those words. He attacks messengers, it's his MO.


    * because I've watched some of Heller's videos and read what he writes.


  • Registered Users, Registered Users 2 Posts: 8,221 ✭✭✭Gaoth Laidir


    posidonia wrote: »
    Sorry, again, I wasn't replying to you. I know, for a fact*, Heller uses and has used those words. He attacks messengers, it's his MO.


    * because I've watched some of Heller's videos and read what he writes.

    That could be the case, but if you don't take each case on its merits then you're no better yourself. Expose his flaws one by one, but do it by factual proof and not some preconceived bias.


  • Registered Users, Registered Users 2 Posts: 1,539 ✭✭✭SeaBreezes


    SeaBreezes wrote: »
    So, Arkasia I get that you don't like him.
    And I understand anyone querying the narrative in your mind is a " attending contrarian conferences where they pretend that they have the knowledge or expertise to debunk an established scientific consensus"

    Wow.

    Zharakova - PhD in Astrophysics
    Nikolov- PhD Physical Sciences
    Zeller - PhD in Fluid Mechanics and Wind Engineering
    Contrarions the lot of them!! Tsck. They'll give anyone a PhD in AstroPhysics these days... :-) :-)

    But I will repeat Gaoth Laiders question for the third time in regards the RSS data discrepancies referred to both in the Climategate emails and illustrated in his video.

    He's spot on about this.
    And the NCAR graphs, and the newspapers at the time.

    Your dislike of him does not change the facts.

    Still waiting for the actual data rebuttal?
    I guess that means he is correct.


  • Registered Users, Registered Users 2 Posts: 22,805 ✭✭✭✭Akrasia


    Oneiric 3 wrote: »
    I know very little about him myself, but there must be something in what he says if there are credible people on this forum citing him.

    I think it's the opposite, the fact that people on this forum are quoting him makes them less credible

    Heller tries to 'debunk' potholer54 on youtube and gets absolutely destroyed by the simple strategy of asking him to back up his own claims with his sources, and pointing out where he misquoted him and misrepresented the science

    If you have a bit of time it's worth checking out the full debate

    https://www.youtube.com/watch?v=uE-zY0roNfw&list=PLIhjKYKf766APsZlSxNkDl0-Ep-7XklcE&index=1


  • Registered Users, Registered Users 2 Posts: 2,855 ✭✭✭Nabber


    Shame to see that one side is attacking the authour and not the data.


    If you oppose AGW prepare yourself -
    I am setting a mission for myself to find one wrong thing you said once, and use it to destroy your credibility, absolutely and utterly, now and forever.


  • Advertisement
  • Registered Users, Registered Users 2 Posts: 216 ✭✭posidonia


    Nabber wrote: »
    Shame to see that one side is attacking the authour and not the data.


    If you oppose AGW prepare yourself -


    People who oppose AGW scepticism, people who also demand properly quality controlled climate data, get all sorts of personal attacks - watch some of Tony Heller's videos for examples.


  • Registered Users, Registered Users 2 Posts: 6,238 ✭✭✭Oneiric 3


    Don't you get it?

    Oh I do, more than I'll ever let on..

    New Moon


  • Registered Users, Registered Users 2 Posts: 6,238 ✭✭✭Oneiric 3


    Akrasia wrote: »
    I think it's the opposite, the fact that people on this forum are quoting him makes them less credible

    Heller tries to 'debunk' potholer54 on youtube and gets absolutely destroyed by the simple strategy of asking him to back up his own claims with his sources, and pointing out where he misquoted him and misrepresented the science

    If you have a bit of time it's worth checking out the full debate

    https://www.youtube.com/watch?v=uE-zY0roNfw&list=PLIhjKYKf766APsZlSxNkDl0-Ep-7XklcE&index=1

    Thanks, I'll give that a watch later. Just hope I am not bombarded with loads of graphs and talk of 'per doublings' and all of that!

    New Moon


  • Registered Users, Registered Users 2 Posts: 1,539 ✭✭✭SeaBreezes


    SeaBreezes wrote: »
    Still waiting for the actual data rebuttal?
    I guess that means he is correct.

    Still waiting..


  • Registered Users, Registered Users 2 Posts: 1,539 ✭✭✭SeaBreezes


    Longing wrote: »
    Yes the did.

    Tony will tell you. Listen and watch.


    No 1.


    No2.

    Just to remind people the videos we are talking about.


  • Registered Users, Registered Users 2 Posts: 8,221 ✭✭✭Gaoth Laidir


    Akrasia wrote: »
    I think it's the opposite, the fact that people on this forum are quoting him makes them less credible

    Heller tries to 'debunk' potholer54 on youtube and gets absolutely destroyed by the simple strategy of asking him to back up his own claims with his sources, and pointing out where he misquoted him and misrepresented the science

    If you have a bit of time it's worth checking out the full debate

    https://www.youtube.com/watch?v=uE-zY0roNfw&list=PLIhjKYKf766APsZlSxNkDl0-Ep-7XklcE&index=1

    Maybe I'm missing something but where is this debate? That's his original video.


  • Registered Users, Registered Users 2 Posts: 216 ✭✭posidonia


    SeaBreezes wrote: »
    Just to remind people the videos we are talking about.
    Right, I’ve just listened to Heller’s first video:

    Some notes, take quickly as he spoke, so not edited for clarity – this is my quick take on the video.

    Canada in a deep freeze , he jumps to global temperatures – you can’t compare Canada with the globe! Sneers about early 1900s. Jumps to early 2000, then to current record, uses the word ‘hiding’, claims the data is unreliable, how does he know? Talks about surface data does not include oceans. Calls them ‘bogus’ goes back 45 yrs – so of course its going to be 45 years out…Accuses NASA of erasing data. Claim CO2 does not control the climate, doesn’t back up that claim! Now he’s talking about climate gate. Why do they (the global series) all agree, he asks. Now he’s talking about a conspiracy. ‘colluded’. ‘Collusion’. Looks at global records, tries to debunk them by citing specific, cherry picked examples, local climate debunks a global record – huh? How can local cherry picked example refute a global record??? Cites newspapers – are they credible? Continues to cherry pick examples. More cherry picking (me - some people live to 100 but also smoke, what does that prove?). More cherry picking. More cherry picking. More cherry picking. More cherry picking. Compares local with global – you can’t disprove a global data set with single local examples! More cherry picking. More cherry picking. More cherry picking. Glaciers grew in Norway in 1963 – think about that any weather watchers here over 60! More cherry picking (and the global warming levels). More cherry picking.. So, as a summary he puts forwards all these local cherry picked example to try a show the govt graphs of GLOBAL temperatures are wrong. Think about that people! He talks about ‘data tampering’. Last year very cool in the US? He must be kidding! NOAA ‘alters data to create a warming trend’ , ‘propaganda’. Junk science, collusion. Australian fires ‘normal’ – blimey.


    So, where’s the credibility in what Heller says? Where is HIS graph of what HE THINKS global temperature really are over the last 150 years? Why is he making accusations all the time? Why doesn’t he just tell us what he thinks the true record of global temperature over the last 150 years is?


  • Registered Users, Registered Users 2 Posts: 22,805 ✭✭✭✭Akrasia


    Maybe I'm missing something but where is this debate? That's his original video.

    It's one via a series of videos. Heller started by making a video about Potholer, then Potholer made a video response. They go back and forth over a series of 10 videos which should be linked in the right of the screen.
    On youtube mobile, it should be a playlist


  • Registered Users, Registered Users 2 Posts: 216 ✭✭posidonia


    Right video two:

    Again, quick notes as I listened

    Surface record ‘corrupted’ but now the the same thing being done with sats. Talks about a US politician. Record ‘deliberately ‘cooled to create appearance’, ‘tampering’. Alleges Mears put under pressure – provides no evidence for this claim. Talks about ‘fraudulent’ surface temperatures. Accuses RSS - but must know RSS updates are frequent. ‘tampering’. Heller think he should be allowed to review a paper by Mears – why?! (UAH also has frequent updates). Compares graphs – obviously hasn’t (you know, not a big ask?) actually read what Mears did, the papers Mears has written…’Climate alarmists’. ‘Climate mafia’. ‘What Mears did’ – has he read what Mears did? Almost certainly not. ‘Climate inquisition’. Implies (again, no evidence whatsoever to back up his claim) Mears was told what to do. He concludes by saying it ‘has noting to do with science’.

    But what does conspiracy theorising and making baseless accusations without providing an iota of evidence for such allegations have to do with science or with getting at the truth?


  • Registered Users, Registered Users 2 Posts: 8,221 ✭✭✭Gaoth Laidir


    Akrasia wrote: »
    It's one via a series of videos. Heller started by making a video about Potholer, then Potholer made a video response. They go back and forth over a series of 10 videos which should be linked in the right of the screen.
    On youtube mobile, it should be a playlist

    That's hilarious. Best hour I've spent on Youtube in a long time! :D

    Heller does come out of it the worst, first with the personal insult, then rehashing the same argument on Milankovitch cycles that Potholer already dealth with. In this case, Heller does himself no favours.

    That said, that does not automatically mean that from this day forward I will automatically disregard everything he says just because he lost this argument. As Potholer said, fact-checking is the way to do science. It's a little ironic that you're quoting this debate in support of Potholer, yet are completely doing the opposite to what he claims by not fact-checking things that are posted here but merely doing reverse "appealing to authority" and disregarding something because of who said it.

    So the question still remains regarding that second video and the Mears' alleged adjustment of the RSS data to better match the model projections. Doesn't matter if Heller brought it up. If it's true it's true, and vice versa.


  • Advertisement
  • Registered Users, Registered Users 2 Posts: 216 ✭✭posidonia


    That's hilarious. Best hour I've spent on Youtube in a long time! :D

    Heller does come out of it the worst, first with the personal insult, then rehashing the same argument on Milankovitch cycles that Potholer already dealth with. In this case, Heller does himself no favours.

    That said, that does not automatically mean that from this day forward I will automatically disregard everything he says just because he lost this argument. As Potholer said, fact-checking is the way to do science. It's a little ironic that you're quoting this debate in support of Potholer, yet are completely doing the opposite to what he claims by not fact-checking things that are posted here but merely doing reverse "appealing to authority" and disregarding something because of who said it.

    So the question still remains regarding that second video and the Mears' alleged adjustment of the RSS data to better match the model projections. Doesn't matter if Heller brought it up. If it's true it's true, and vice versa.


    Why do you regard Mears as guilty until proven innocent?


  • Registered Users, Registered Users 2 Posts: 18,064 ✭✭✭✭Thargor


    posidonia wrote: »
    Right, I’ve just listened to Heller’s first video:

    Some notes, take quickly as he spoke, so not edited for clarity – this is my quick take on the video.

    Canada in a deep freeze , he jumps to global temperatures – you can’t compare Canada with the globe! Sneers about early 1900s. Jumps to early 2000, then to current record, uses the word ‘hiding’, claims the data is unreliable, how does he know? Talks about surface data does not include oceans. Calls them ‘bogus’ goes back 45 yrs – so of course its going to be 45 years out…Accuses NASA of erasing data. Claim CO2 does not control the climate, doesn’t back up that claim! Now he’s talking about climate gate. Why do they (the global series) all agree, he asks. Now he’s talking about a conspiracy. ‘colluded’. ‘Collusion’. Looks at global records, tries to debunk them by citing specific, cherry picked examples, local climate debunks a global record – huh? How can local cherry picked example refute a global record??? Cites newspapers – are they credible? Continues to cherry pick examples. More cherry picking (me - some people live to 100 but also smoke, what does that prove?). More cherry picking. More cherry picking. More cherry picking. More cherry picking. Compares local with global – you can’t disprove a global data set with single local examples! More cherry picking. More cherry picking. More cherry picking. Glaciers grew in Norway in 1963 – think about that any weather watchers here over 60! More cherry picking (and the global warming levels). More cherry picking.. So, as a summary he puts forwards all these local cherry picked example to try a show the govt graphs of GLOBAL temperatures are wrong. Think about that people! He talks about ‘data tampering’. Last year very cool in the US? He must be kidding! NOAA ‘alters data to create a warming trend’ , ‘propaganda’. Junk science, collusion. Australian fires ‘normal’ – blimey.


    So, where’s the credibility in what Heller says? Where is HIS graph of what HE THINKS global temperature really are over the last 150 years? Why is he making accusations all the time? Why doesn’t he just tell us what he thinks the true record of global temperature over the last 150 years is?
    posidonia wrote: »
    Right video two:

    Again, quick notes as I listened

    Surface record ‘corrupted’ but now the the same thing being done with sats. Talks about a US politician. Record ‘deliberately ‘cooled to create appearance’, ‘tampering’. Alleges Mears put under pressure – provides no evidence for this claim. Talks about ‘fraudulent’ surface temperatures. Accuses RSS - but must know RSS updates are frequent. ‘tampering’. Heller think he should be allowed to review a paper by Mears – why?! (UAH also has frequent updates). Compares graphs – obviously hasn’t (you know, not a big ask?) actually read what Mears did, the papers Mears has written…’Climate alarmists’. ‘Climate mafia’. ‘What Mears did’ – has he read what Mears did? Almost certainly not. ‘Climate inquisition’. Implies (again, no evidence whatsoever to back up his claim) Mears was told what to do. He concludes by saying it ‘has noting to do with science’.

    But what does conspiracy theorising and making baseless accusations without providing an iota of evidence for such allegations have to do with science or with getting at the truth?
    The point of posting rambling nonsense videos as an argument in these threads is that the person who posted them can just sit back and say "Did you watch the video?" in response to any criticism of their statements, safe in the knowledge that nobody is actually going to waste their time on that crap. You're not supposed to actually watch them! That ruins the whole plan.


  • Registered Users, Registered Users 2 Posts: 22,805 ✭✭✭✭Akrasia


    Thargor wrote: »
    The point of posting rambling nonsense videos as an argument in these threads is that the person who posted them can just sit back and say "Did you watch the video?" in response to any criticism of their statements, safe in the knowledge that nobody is actually going to waste their time on that crap. You're not supposed to actually watch them! That ruins the whole plan.

    Right so, I'll get started going through Heller's videos and checking his facts. Despite his reputation for making up nonsense and misrepresenting science, I'll take every single one of his claims at face value as if I had never heard of him before.

    While I'm doing this, can one of the skeptics on here take a look at this for me please?

    https://www.ipcc.ch/site/assets/uploads/2018/05/SYR_AR5_FINAL_full_wcover.pdf

    Now, you need to go through it and check every single claim you disagree with and provide evidence from a good authoritative source for why this claim is wrong.
    It's a bit long so I'll be patient, you don't have to do it all at once. Who wants to start it off?


  • Registered Users, Registered Users 2 Posts: 22,805 ✭✭✭✭Akrasia


    posidonia wrote: »
    Right video two:

    Again, quick notes as I listened

    Surface record ‘corrupted’ but now the the same thing being done with sats. Talks about a US politician. Record ‘deliberately ‘cooled to create appearance’, ‘tampering’. Alleges Mears put under pressure – provides no evidence for this claim. Talks about ‘fraudulent’ surface temperatures. Accuses RSS - but must know RSS updates are frequent. ‘tampering’. Heller think he should be allowed to review a paper by Mears – why?! (UAH also has frequent updates). Compares graphs – obviously hasn’t (you know, not a big ask?) actually read what Mears did, the papers Mears has written…’Climate alarmists’. ‘Climate mafia’. ‘What Mears did’ – has he read what Mears did? Almost certainly not. ‘Climate inquisition’. Implies (again, no evidence whatsoever to back up his claim) Mears was told what to do. He concludes by saying it ‘has noting to do with science’.

    But what does conspiracy theorising and making baseless accusations without providing an iota of evidence for such allegations have to do with science or with getting at the truth?
    Keep going, You're in for a treat, he's going to start making fun of Potholers accent soon.


  • Registered Users, Registered Users 2 Posts: 1,176 ✭✭✭Longing


    Tony really slaps those alarmists with there fake predictions. I mean propaganda.


    History can be a real pain is the ass.


  • Registered Users, Registered Users 2 Posts: 462 ✭✭oriel36


    Heller does come out of it the worst, first with the personal insult, then rehashing the same argument on Milankovitch cycles....

    Nothing like the soothing tones of a middle class Brit who really is out of his depth. The Milankovitch cycles are junk that obscures the real sticking points at the emergence of heliocentric reasoning and arguments.

    https://www.youtube.com/watch?v=WLjkLPnIPPw&t=172s


    The foundations of heliocentric astronomy are based on the relationship of the North/South Poles to the central Sun and the circle of illumination over an annual cycle -

    "The third is the motion in declination. For, the axis of the daily rotation is not parallel to the Grand Orb's axis, but is inclined [to it at an angle that intercepts] a portion of a circumference, in our time about 23 1/2°. Therefore, while the earth's center always remains in the plane of the ecliptic, that is, in the circumference of a circle of the Grand Orb, the earth's poles rotate, both of them describing small circles about centers [lying on a line that moves] parallel to the Grand Orb's axis. The period of this motion also is a year, but not quite, being nearly equal to the Grand Orb's [revolution]. " Copernicus

    http://copernicus.torun.pl/en/archives/astronomical/1/?view=transkrypcja&

    This is what the North Pole looks like in the description above as an annual motion -

    https://en.wikipedia.org/wiki/Axial_precession#/media/File:Earth_precession.svg

    Seeing that you are all lost when it comes to planetary dynamics and timekeeping, here is the explanation why Copernicus altered his description by the time he published De Revolutionibus.

    The framework Copernicus used was from Ptolemy and relied on the direct motion of the Sun through the constellations -

    "Moreover, we see the other five planets also retrograde at times, and
    stationary at either end [of the regression]. And whereas the sun
    always advances along its own direct path, they wander in various
    ways, straying sometimes to the south and sometimes to the north; that
    is why they are called "planets" [wanderers]. Copernicus

    Of course the theorists today put the Sun in a wandering motion and have no respect for heliocentricity nor the first astronomers who worked on a moving Earth in a stationary Sun centred system.

    The older system of reckoning involved the first seasonal appearance of stars which creates not only the calendar system but also the proportion of rotations per orbital circuit -

    ".. on account of the procession of the rising of Sirius by one day in the course of 4 years,.. therefore it shall be, that the year of 360 days and the 5 days added to their end, so one day shall be from this day after every 4 years added to the 5 epagomenae before the new year" Canopus Decree 238 BC

    This amounts to 1461 days for 4 complete orbital circuits or 365 1/4 days per circuit which in dynamical terms represents 365 1/4 rotations per orbital circuit to a close proximity.

    The slight drift in the positions of stars was known as the precession of the equinoxes in the Ptolemaic framework but in the older framework of the Egyptians it can be recognised as the same drift as a further refinement of the leap day correction, after all, the links between timekeeping to the daily and planetary cycles are not exact and always need adjusting to bring timekeeping in line with the planetary proportions. The clockwork modelers of the late 17th century lost the run of themselves and tried to make planetary motions subservient to timekeeping averages (clock and calendar system).

    Copernicus was obligated to work with the framework of Ptolemy as that framework provided decent predictions of astronomical events like eclipses as dates within the calendar but had he put his observations in the older framework where the stars change position from an evening to morning appearance *, his description would have worked out fine and people today would not be talking about 'climate change' - they would be discussing the cause of the Polar day/night cycle and the rotation behind it.


    It is like explaining a Saturn V rocket engine to people playing around with sticks but having the historical and technical details on my side is all that counts. That what people get for following late 17th century Royal Society contortions exclusively

    * https://sol24.net/data/html/SOHO/C3/96H/VIDEO/


  • Registered Users, Registered Users 2 Posts: 8,221 ✭✭✭Gaoth Laidir


    posidonia wrote: »
    Why do you regard Mears as guilty until proven innocent?

    Where did I say that? I haven't accused him of anything. I was merely pointing out that he allegedly (I used that word) rewrote the mean temperature curve by using the top of the positive error boundary. I didn't say he did it, Heller said it.


  • Registered Users, Registered Users 2 Posts: 1,539 ✭✭✭SeaBreezes


    Still waiting ....

    So the question still remains regarding that second video and the Mears' alleged adjustment of the RSS data to better match the model projections. Doesn't matter if Heller brought it up. If it's true it's true, and vice versa.

    Also the NCAR data 'adjustments' ...

    Also the extreme temps in Middle East and Africa WHERE they have NO sensors...


  • Registered Users, Registered Users 2 Posts: 8,221 ✭✭✭Gaoth Laidir


    Akrasia wrote: »
    Right so, I'll get started going through Heller's videos and checking his facts. Despite his reputation for making up nonsense and misrepresenting science, I'll take every single one of his claims at face value as if I had never heard of him before.

    While I'm doing this, can one of the skeptics on here take a look at this for me please?

    https://www.ipcc.ch/site/assets/uploads/2018/05/SYR_AR5_FINAL_full_wcover.pdf

    Now, you need to go through it and check every single claim you disagree with and provide evidence from a good authoritative source for why this claim is wrong.
    It's a bit long so I'll be patient, you don't have to do it all at once. Who wants to start it off?

    Nice try. My asking you to comment on one thing Heller claimed is slightly less arduous than asking someone to pick holes in a 140-page document, especially since the main points of contention in it have already been repeatedly discussed in this and many other threads ad nauseaum. But it's nice to see you're tacking the Heller claim in an impartial manner.


  • Advertisement
  • Registered Users, Registered Users 2 Posts: 216 ✭✭posidonia


    Where did I say that? I haven't accused him of anything. I was merely pointing out that he allegedly (I used that word) rewrote the mean temperature curve by using the top of the positive error boundary. I didn't say he did it, Heller said it.


    I know, but you recycled what Heller said. But, it's never nice being accused (and wrongfully) is it......Heller knows if he throws enough mud he might be able to get some to stick.


  • Registered Users, Registered Users 2 Posts: 216 ✭✭posidonia


    SeaBreezes wrote: »
    Still waiting ....

    So the question still remains regarding that second video and the Mears' alleged adjustment of the RSS data to better match the model projections. Doesn't matter if Heller brought it up. If it's true it's true, and vice versa.

    Also the NCAR data 'adjustments' ...

    Also the extreme temps in Middle East and Africa WHERE they have NO sensors...


    Then let Heller take the evidence to the police (or are the police in on the scam?). As it is he, and you, are mud slinging.


  • Registered Users, Registered Users 2 Posts: 1,539 ✭✭✭SeaBreezes


    posidonia wrote: »

    Where is HIS graph of what HE THINKS global temperature really are over the last 150 years? Why is he making accusations all the time? Why doesn’t he just tell us what he thinks the true record of global temperature over the last 150 years is?

    He shows you when he overlays the original (unadjusted) NCAR data against the new adjusted data?

    And choosing the higher error margin every time? From only one model? The one that suits the narrative?
    Who's cherry picking there? How on earth is that ANY kind of credible science?

    Even the met office warned them against it as bad science.. and that was in 2007, and that was when they used the MEAN of the error margin.

    How did you miss all that info?


  • Registered Users, Registered Users 2 Posts: 216 ✭✭posidonia


    Longing wrote: »
    Tony really slaps those alarmists with there fake predictions. I mean propaganda.


    History can be a real pain is the ass.


    Its late, but I guess I'll 'have' to go through this video too, at some point. Can you give me an idea how many I'll have to refute before you stop posting them?


  • Registered Users, Registered Users 2 Posts: 8,221 ✭✭✭Gaoth Laidir


    posidonia wrote: »
    I know, but you recycled what Heller said. But, it's never nice being accused (and wrongfully) is it......Heller knows if he throws enough mud he might be able to get some to stick.

    What does recycled mean? You wrote out running commentaries on his two videos earlier. Does that constitute recycling too? Despite all the words, your summary was not based on facts but more on a sarcastic tone that I reckon you had decided to adopt before clicking Play. Pretty much exactly what you accuse Heller of doing himself.


  • Registered Users, Registered Users 2 Posts: 216 ✭✭posidonia


    SeaBreezes wrote: »
    He shows you when he overlays the original (unadjusted) NCAR data against the new adjusted data?

    And choosing the higher error margin every time? From only one model? The one that suits the narrative?
    Who's cherry picking there?


    Heller.

    How on earth is that ANY kind of credible science?

    Even the met office warned them against it as bad science.. and that was in 2007, and that was when they used the MEAN of the error margin.

    How did you miss all that info?


    You asked people to look at the video and give their views, I did that.


  • Advertisement
  • Registered Users, Registered Users 2 Posts: 14,757 ✭✭✭✭M.T. Cranium


    Not sure what happened to that amended version of "Tormax" but will try again, have a look below the original graph, around cells A48 and below, I have added a graph of the average dates of record highs through the year. It shows quite clearly that the only parts of the year really responding to the postulated recent warming are the early and late portions of winter. All other parts of the year have seen a more random distribution within the warmer phase since 1890.

    (renamed file, hope it is visible now)


  • Registered Users, Registered Users 2 Posts: 1,539 ✭✭✭SeaBreezes


    posidonia wrote: »
    Heller.
    You asked people to look at the video and give their views, I did that.

    I didn't. I asked for anyone to show how those two examples of data adjustment that he illustrated was incorrect.

    You can't because in this case, he's correct.

    I don't know the man, and I don't have to agree with everything he says or does, it's not a cult, it's a critical analysis of these three points.

    1) NCAR pre and post adjustment..

    2) RSS values, also only using the one model... UK met disapproved,

    3) Highest temps in Sept from a landmass where there ARE no sensors? Are these guesstimated? Where do they come from?

    But your ok with this? You think it is credible science? That's fine.

    I don't.


  • Registered Users, Registered Users 2 Posts: 1,176 ✭✭✭Longing


    posidonia wrote: »
    Its late, but I guess I'll 'have' to go through this video too, at some point. Can you give me an idea how many I'll have to refute before you stop posting them?

    You haven't giving any evidence to show the charts Heller showed were wrong. You tried to divert the true data you saw into something that was not relevant.

    By the way I can't wait for your reply to the last Heller video I posted.


  • Registered Users, Registered Users 2 Posts: 6,238 ✭✭✭Oneiric 3


    Watched the first couple of vids in that series. My God, but he does drone on a bit, but he did make a good point the the 'AMO' and its relationship to the Reykjavik temp series. I think I posted a chart a few years back of Valentia data and its relationship to the AMO and while there was a clear correlation, I don't think it was as marked.. but my memory is pulp so I could be wrong there.

    I see there is a 'Part 3' in the playlist waiting to be watched. It can feck off till tomorrow.

    New Moon


  • Registered Users, Registered Users 2 Posts: 1,539 ✭✭✭SeaBreezes


    Longing wrote: »
    Yes the did.

    Tony will tell you. Listen and watch.


    No 1.


    No2.

    By the way thanks for the videos Longing! Certainly sparked a lively debate.


  • Advertisement
  • Registered Users, Registered Users 2 Posts: 22,805 ✭✭✭✭Akrasia


    What does recycled mean? You wrote out running commentaries on his two videos earlier. Does that constitute recycling too? Despite all the words, your summary was not based on facts but more on a sarcastic tone that I reckon you had decided to adopt before clicking Play. Pretty much exactly what you accuse Heller of doing himself.

    Its hard to watch that video series without coming away with the impression that Heller is a total spoofer

    You can say he just had a bad day, but those exchanges happened over 8 months and he had ample opportunity to prepare

    Can you think of a single point he made that was properly insightful or demonstrated a good grasp of the subject matter beyond what you would expect from an undergraduate coasting through a climate change module in a general science degree?

    Do you recognise that he made a number of fundamental errors in his interpretation of scientific papers as pointed out by Hadfield (potholer54)?


  • Registered Users, Registered Users 2 Posts: 22,805 ✭✭✭✭Akrasia


    SeaBreezes wrote: »
    By the way thanks for the videos Longing! Certainly sparked a lively debate.

    Nobody has said anything in support of Heller yet except 'watch the video and tell us why this specific video is wrong'


    I notice nobody has taken up the challenge of finding any flaws in the document I linked to...


  • Registered Users, Registered Users 2 Posts: 1,539 ✭✭✭SeaBreezes


    "Akrasia wrote: »

    Can you think of a single point he made that was properly insightful or demonstrated a good grasp of the subject?

    1) NCAR data 'adjusted' to hide previous warming. Illustrated with overlaid charts.

    2) RSS data 'adjusted' to show warming (Met Office not happy not good science) also illustrated.

    3) Max temps listed in places there are NO sensors? Is it guesstimated? To the highest error margin again?


  • Registered Users, Registered Users 2 Posts: 1,539 ✭✭✭SeaBreezes


    Akrasia wrote: »
    Nobody has said anything in support of Heller yet except 'watch the video and tell us why this specific video is wrong'


    I notice nobody has taken up the challenge of finding any flaws in the document I linked to...

    You first :-)


  • Registered Users, Registered Users 2 Posts: 8,221 ✭✭✭Gaoth Laidir


    Not sure what happened to that amended version of "Tormax" but will try again, have a look below the original graph, around cells A48 and below, I have added a graph of the average dates of record highs through the year. It shows quite clearly that the only parts of the year really responding to the postulated recent warming are the early and late portions of winter. All other parts of the year have seen a more random distribution within the warmer phase since 1890.

    (renamed file, hope it is visible now)

    Here's the chart you speak of, posted here for easier discussion. It certainly is an interesting way of looking at things and does pose some strong questions. It would be good to have it for more locations.

    500365.png


  • Registered Users, Registered Users 2 Posts: 14,757 ✭✭✭✭M.T. Cranium


    Thanks for posting that version, so to cut out the step of clicking on the file to see the discussion --

    (the posted version has the two colours reversed, if GL can edit his post, the blue and red should have each other's explanation above the graph)

    the blue curve in the graph is elapsed average date of record high (in the period 1840 to 2019). Most of the records come from the warmer climate period that began around 1890. But I've found that the frequency of new records did not accelerate significantly, except in the two parts of the year where the red curves (running 10-d mean) get up around 1980, namely late Nov into Dec, and Feb into March. In other words, the start and end of the winter season -- that's when recent temperature increases have peaked. On a daily basis (graph will be available in a day or two) the peak increases occur Feb 19-21 and Nov 29-Dec 2.

    Towards mid-winter, the modern warming fades out and January has not shown much warming at all, in fact Jan 19-20 have cooled since 1970, and several other parts of January have shown no real change. From April to mid-November, the red oscillating curves show that most of the record highs are well back in the data period. The number of new records set, as I mentioned in a previous post, is far from spectacular in May-June and August-September. July seems to be somewhat more evenly mixed but then I found that the only new July records have replaced the seven weakest records from the old set -- the stronger records in the upper 90s and low 100s F remain in place.

    This is a very similar finding to the arctic studies that I have done -- except that up at those latitudes, the warming comes in May and September as those are the ends of the much longer winter season.

    My conclusion is that this is all more easily explained by changes in the circulation bringing warm air masses north more frequently, than by air mass modification which is the implied mechanism of the AGW signal. I do think there has been subtle air mass modification but not enough to change the frequency of record highs. Possibly the increase in cloudiness that some research has mentioned is off-setting the air mass modification and making it more of a nocturnal phenomenon.


  • Registered Users, Registered Users 2 Posts: 8,221 ✭✭✭Gaoth Laidir


    Thanks for posting that version, so to cut out the step of clicking on the file to see the discussion --

    (the posted version has the two colours reversed, if GL can edit his post, the blue and red should have each other's explanation above the graph)

    the blue curve in the graph is elapsed average date of record high (in the period 1840 to 2019). Most of the records come from the warmer climate period that began around 1890. But I've found that the frequency of new records did not accelerate significantly, except in the two parts of the year where the red curves (running 10-d mean) get up around 1980, namely late Nov into Dec, and Feb into March. In other words, the start and end of the winter season -- that's when recent temperature increases have peaked. On a daily basis (graph will be available in a day or two) the peak increases occur Feb 19-21 and Nov 29-Dec 2.

    Towards mid-winter, the modern warming fades out and January has not shown much warming at all, in fact Jan 19-20 have cooled since 1970, and several other parts of January have shown no real change. From April to mid-November, the red oscillating curves show that most of the record highs are well back in the data period. The number of new records set, as I mentioned in a previous post, is far from spectacular in May-June and August-September. July seems to be somewhat more evenly mixed but then I found that the only new July records have replaced the seven weakest records from the old set -- the stronger records in the upper 90s and low 100s F remain in place.

    This is a very similar finding to the arctic studies that I have done -- except that up at those latitudes, the warming comes in May and September as those are the ends of the much longer winter season.

    My conclusion is that this is all more easily explained by changes in the circulation bringing warm air masses north more frequently, than by air mass modification which is the implied mechanism of the AGW signal. I do think there has been subtle air mass modification but not enough to change the frequency of record highs. Possibly the increase in cloudiness that some research has mentioned is off-setting the air mass modification and making it more of a nocturnal phenomenon.

    Sorry, fixed my stupid mistake now. Here's the first chart in the file too.

    500366.png


  • Registered Users, Registered Users 2 Posts: 2,855 ✭✭✭Nabber


    Akrasia wrote: »

    While I'm doing this, can one of the skeptics on here take a look at this for me please?

    https://www.ipcc.ch/site/assets/uploads/2018/05/SYR_AR5_FINAL_full_wcover.pdf

    Now, you need to go through it and check every single claim you disagree with and provide evidence from a good authoritative source for why this claim is wrong.
    It's a bit long so I'll be patient, you don't have to do it all at once. Who wants to start it off?

    IPPC Chairman (at the time) Rajendra K. Pachauri. Is he still battling sexual harassment charges?
    For that reason I can't read that document.


    Am I doing it right Akrasia? Or do I attack his character some more?


  • Registered Users, Registered Users 2 Posts: 14,757 ✭✭✭✭M.T. Cranium


    Thanks a lot, I should just add that the "random chance" line in the second graph posted only applies to the records set in each year not the retained records which all have the same probability of 2.03 per year after 180 years.

    So it's only the orange-red / blue lines which relate to the descending curve of expected numbers of records. (these are more or less the same measure, the blue shows days with a record, the orange-red reduces that by ties to its statistical count, e.g., a year has ten records but one is a tie, so the true count is 9.5 for that year).

    The orange-yellow line at the bottom of the graph refers to retained records and every year has the same chance of holding those, you can see where the climate really warmed up from the surge in retained records around 1900.


  • Registered Users, Registered Users 2 Posts: 14,757 ✭✭✭✭M.T. Cranium


    As to the document we were asked to review, the obvious problem leaps off the page in the graph showing relative size of forcings. Natural variability is assigned a + or - 0.1 C deg input. This is far too small. So it shows that the entire premise of the IPCC is wrong, that the demonstrated increases in greenhouse gases are not the entire cause of the warming we have seen, and may not even be the main cause.

    However, the main foundation of my unease with the IPCC approach is a false sense of security that they create with their concept of avoiding thermal catastrophe by going green. It won't work. There isn't enough variation in that factor to make our partial changes (full-scale changes just lead to another form of disaster) capable of making a large impact on what I would see as nearly inevitable warming anyway.

    If the IPCC have that factor wrong then everything else they say is disproportionate to the reality of climate change. This is what they are tasked to work out, and I think they have failed.


  • Advertisement
This discussion has been closed.
Advertisement