Advertisement
If you have a new account but are having problems posting or verifying your account, please email us on hello@boards.ie for help. Thanks :)
Hello all! Please ensure that you are posting a new thread or question in the appropriate forum. The Feedback forum is overwhelmed with questions that are having to be moved elsewhere. If you need help to verify your account contact hello@boards.ie

Relaxation of Restrictions, Part XII *Read OP For Mod Warnings*

Options
11081091111131141115

Comments

  • Registered Users Posts: 18,996 ✭✭✭✭gozunda


    _Kaiser_ wrote: »
    If you throw a starving man a sandwich, it's going to be the best sandwich he's ever had, no matter the content! Well, I don't know about that, but certainly we have a lot more in common culturally and otherwise with our nearest neighbours than we do with our EU overlords for whom we're an occasional thorn (corporation tax) and stick to beat the UK with (Brexit).To be fair, we have only been at the independence lark for just about 100 years I suppose. It shouldn't be surprising that we've largely made a balls of it so far (and keep trying to hand it back - first to the Church, then to the EU) with scandal after scandal since the foundation of the State, never-ending political incompetence, waste and corruption, and a population that largely doesn't think beyond their own driveway or how something will affect them personally. We're still very immature as a nation and this is reflected in the decisions made, the actions and attitudes of many, and our constant need for validation and approval from our "betters".

    Leaving aside the hyperbole about sandwiches etc - using a derogatory term normally reserved as an anti Irish insult is a fairly ignorant thing all the same.

    But one thing for sure - apparently we haven't left off with is the need for wilful self flagilation where some believe that the country and its people are without question the worst in the world and by extension everywhere else is somehow better. News for you - not so. And no - no one is saying things here are perfect by any stretch of the imagination, but a little perspective is always a useful thing.


  • Registered Users Posts: 11,662 ✭✭✭✭ACitizenErased


    Open to correction but is this the first weekend in a while with no big increase in hospitalisations? 47 last Sunday, 48 today.


  • Registered Users Posts: 293 ✭✭Fils


    Open to correction but is this the first weekend in a while with no big increase in hospitalisations? 47 last Sunday, 48 today.

    It’s an increase of 1.


  • Registered Users Posts: 32,136 ✭✭✭✭is_that_so


    GiftofGab wrote: »
    Yeah but who is going to stand up to Tony??
    They are on antigen testing and in principle on the digital cert idea.


  • Registered Users Posts: 11,662 ✭✭✭✭ACitizenErased


    Fils wrote: »
    It’s an increase of 1.

    That is indeed what I wrote yes


  • Advertisement
  • Registered Users Posts: 18,996 ✭✭✭✭gozunda


    UK continuing its plateau of Delta cases.

    24,248 new cases and 15 deaths, both lower than yesterday.

    This would be the equivalent of 1,865 new cases here with 1 death.

    Tony can fook right off if he continues to propose keeping hospitality closed beyond 19 July.

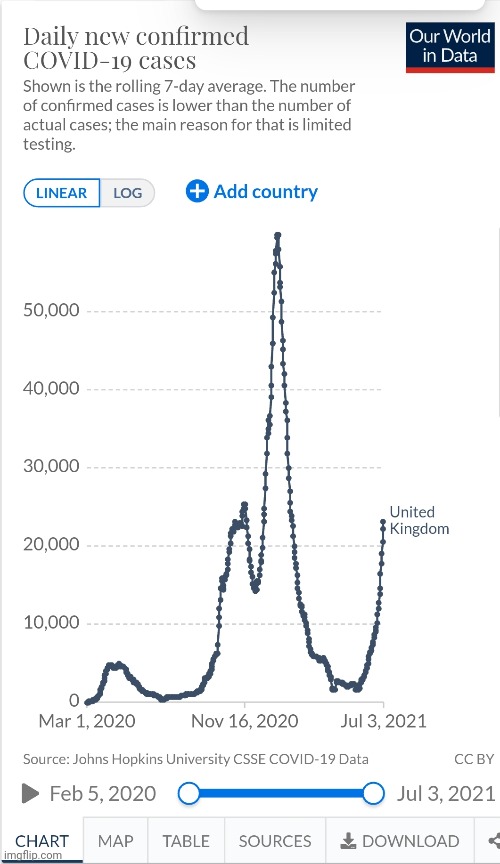
    Here's how things are progressing atm in the UK. Reckon they've a way to go before seeing any plateau ...

    5ffmha.jpg[img][/img]


  • Registered Users Posts: 11,662 ✭✭✭✭ACitizenErased


    gozunda wrote: »
    Here's how things are progressing atm in the UK. Reckon they've a way to go before seeing any plateau ...

    5ffloj.jpg
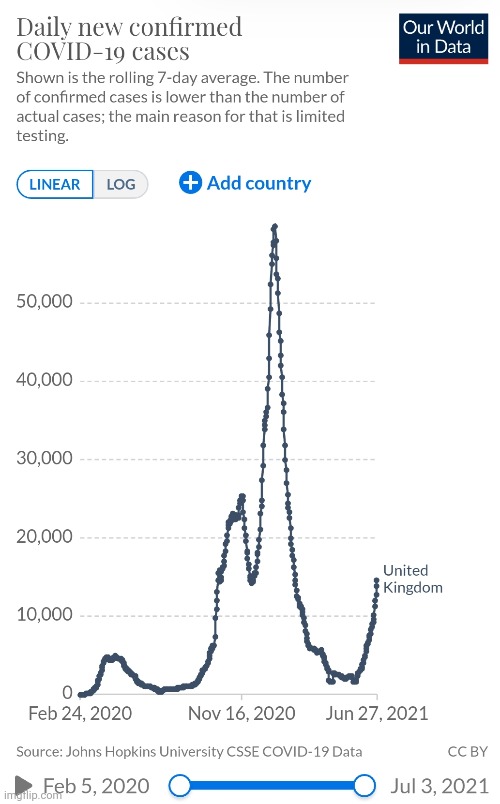
    UK's case graph currently looks like this:
    557561.png
    You've posted the average, not case figures.


  • Registered Users Posts: 18,996 ✭✭✭✭gozunda


    ...
    You've posted the average, not case figures.

    Indeed I did - I posted the rolling 7 day average for new cases. Wouldn't like to misrepresent the data now would we?

    You can check it yourself on Our World in Data

    https://ourworldindata.org/coronavirus/country/united-kingdom#what-is-the-daily-number-of-confirmed-cases


  • Registered Users Posts: 11,662 ✭✭✭✭ACitizenErased


    gozunda wrote: »
    Indeed I did - I posted the rolling 7 day average for new cases. Wouldn't like to misrepresent the data now would we?

    You can check it yourself on Our World in Data

    https://ourworldindata.org/coronavirus/country/united-kingdom#what-is-the-daily-number-of-confirmed-cases
    Rather than show the fact cases decreased 3/4 days in a row you posted a graph that showed the average going directly upwards.


  • Posts: 220 [Deleted User]


    The people desperately trying to spin the UK as some sort of charnel house to prove Tony is right is really quite something.


  • Advertisement
  • Registered Users Posts: 7,760 ✭✭✭Deeper Blue


    Rather than show the fact cases decreased 3/4 days in a row you posted a graph that showed the average going directly upwards.

    You obviously don't know the rules here, you need to choose the data representation that looks the scariest.


  • Registered Users Posts: 18,996 ✭✭✭✭gozunda


    Rather than show the fact cases decreased 3/4 days in a row you posted a graph that showed the average going directly upwards.

    And which do you believe is a more accurate visualisation of whats happening with covid infections there?

    Btw the graph can also go down


  • Registered Users Posts: 2,343 ✭✭✭landofthetree


    https://twitter.com/gavreilly/status/1411656173879693319

    Finally Reid tells the truth. Our hospitals are a joke.


  • Registered Users Posts: 2,891 ✭✭✭Van.Bosch


    Rather than show the fact cases decreased 3/4 days in a row you posted a graph that showed the average going directly upwards.

    But for the last 18 months people have being saying, ignore daily figures, use the 7 day average to rule out day nuances etc. Using the 7 day average makes sense to me. In 2 or 3 days it will reflect the plateau of the last few days.


  • Registered Users Posts: 18,996 ✭✭✭✭gozunda


    b0nk1e wrote: »
    The people desperately trying to spin the UK as some sort of charnel house to prove Tony is right is really quite something.

    Well no - its just a graph showing data. I'd be way more concerned with those claiming there's nothing to see there at all ...


  • Registered Users Posts: 7,636 ✭✭✭Doctor Jimbob


    Allinall wrote: »
    How can something be accurate and misleading?

    That’s just silly.

    Of course something can be accurate and misleading. A recent example would be people quoting the average wage rather than the median, knowing full well how people would interpret it.


  • Registered Users Posts: 11,662 ✭✭✭✭ACitizenErased


    gozunda wrote: »
    A which do you believe is more accurate visualisation of whats happening with covid infections there?

    Btw the graph can also go down
    The average is an accurate way of showing trends in certain contexts. Using it to dispute whether case figures are decreasing day after day over a small period of time is not one of those contexts. The figures don't lie, there have been consecutive decreases for the last 4 days running. The average won't reflect that for a number of days because it's a function of 5-7 days, not 24-72 hours.


  • Registered Users Posts: 11,973 ✭✭✭✭titan18


    Fils wrote: »
    I would imagine indoor dining 2022 is achievable.

    From what I can see, plenty of places have reopened and serving indoors already. Not just rural places but seeing it in Cork city too.


  • Registered Users Posts: 7,636 ✭✭✭Doctor Jimbob


    https://twitter.com/gavreilly/status/1411656173879693319

    Finally Reid tells the truth. Our hospitals are a joke.

    We’re effectively under restrictions as a result of our shambolic health system rather as a direct result of COVID then.

    Another one to add to the growing list of things dismissed as conspiracy theories by posters on here that turned out to be true.


  • Registered Users Posts: 18,211 ✭✭✭✭namloc1980


    The massively spread out crowd in Limerick all wearing masks outdoors is very weird.


  • Advertisement
  • Registered Users Posts: 18,996 ✭✭✭✭gozunda


    The average is an accurate way of showing trends in certain contexts. Using it to dispute whether case figures are decreasing day after day over a small period of time is not one of those contexts. The figures don't lie, there have been consecutive decreases for the last 4 days running. The average won't reflect that for a number of days because it's a function of 5-7 days, not 24-72 hours.

    Nope. Not disputing anything btw. Its simply a graph. One that includes data up to yesterday.

    We know that case numbers on a given date do not necessarily show the number of new cases on that day, but the cases  reported on that day. And since reporting can vary significantly from day to day – irrespectively of any actual variation of cases – it is better to view the seven-day rolling average of the daily figures as we do in the chart here.

    And its a rolling average btw - it moves daily as explained above.


  • Registered Users Posts: 11,662 ✭✭✭✭ACitizenErased


    gozunda wrote: »
    Nope. Not disputing anything btw.

    We know that case numbers on a given date do not necessarily show the number of new cases on that day, but the cases reported on that day. And since reporting can vary significantly from day to day – irrespectively of any actual variation of cases – it is better to view the seven-day rolling average of the daily figures as we do in the chart here.

    And its a rolling average btw - it moves daily.
    You posted it in opposition to the poster who said it's a plateau over the last few days. That is a fact. Posting the average will not change that fact.


  • Registered Users Posts: 18,996 ✭✭✭✭gozunda


    You posted it in opposition to the poster who said it's a plateau over the last few days. That is a fact. Posting the average will not change that fact.

    Nope. Posted to demonstrate that daily figures are not necessarily an accurate representation of the data. Thats a fact.

    Again. We know that case numbers on a given date do not necessarily show the number of new cases on that day, but the cases  reported on that day. And since reporting can vary significantly from day to day – irrespectively of any actual variation of cases – it is better to view the seven-day rolling average of the daily figures as we do in the chart here.


  • Registered Users Posts: 11,662 ✭✭✭✭ACitizenErased


    gozunda wrote: »
    Nope. Posted to demonstrate that daily figures are not necessarily an accurate representation of the data. Thats a fact.
    Well a reduction in r-number this week and 4 days of reducing figures is enough to discuss a possible future trend, whether you like it or not. Posting the average for a larger period of time won't stop that discussion.


  • Registered Users Posts: 18,996 ✭✭✭✭gozunda


    Well a reduction in r-number this week and 4 days of reducing figures is enough to discuss a possible future trend, whether you like it or not. Posting the average for a larger period of time won't stop that discussion.

    Tbf I think that's what we're doing.

    But do you mean this r number?
    R number in England falls slightly to 1.1 to 1.3 despite rise in cases across UK

    England's R number estimate has fallen slightly to between 1.1 and 1.3 despite a rise in coronavirus cases across the UK.

    Last week it was listed as between 1.2 and 1.4.

    The R number is highest in the South West and the North East and Yorkshire. It is thought to be lowest in the east of England, London and the North West.

    The daily growth rate of infections in England was estimated at between 3% and 5%, the same as the previous week.

    https://news.sky.com/story/r-number-in-england-falls-slightly-to-1-1-to-1-3-despite-rise-in-case-numbers-12347078

    As an aside we can of course discuss possible reasons why we're still seeing rising cases despite a slight reduction in the r number in the UK.


  • Registered Users Posts: 18,439 ✭✭✭✭bucketybuck


    We’re effectively under restrictions as a result of our shambolic health system rather as a direct result of COVID then.

    Another one to add to the growing list of things dismissed as conspiracy theories by posters on here that turned out to be true.

    Some of us made this very obvious point 6 months ago when we pointed out that the rational for lockdowns then would logically also apply to other "health emergencies", and as such we should now expect calls for lockdown every winter to "flatten the curve" and "protect the hospitals".

    As usual such comments were dismissed as not possible. Conspiracy nonsense.

    Yet here we are. The usual suspects will again dismiss it because of course they will, but when the head of the HSE in the middle of summer is warning that our hospitals are close to collapse then it doesn't take a rocket surgeon to see what comes later.


  • Registered Users Posts: 6,669 ✭✭✭Allinall


    Of course something can be accurate and misleading. A recent example would be people quoting the average wage rather than the median, knowing full well how people would interpret it.

    That’s 100% on the people who misinterpret it.

    There can’t be anything misleading about facts.


  • Posts: 0 [Deleted User]


    Some of us made this very obvious point 6 months ago when we pointed out that the rational for lockdowns then would logically also apply to other "health emergencies", and as such we should now expect calls for lockdown every winter to "flatten the curve" and "protect the hospitals".

    As usual such comments were dismissed as not possible. Conspiracy nonsense.

    Yet here we are. The usual suspects will again dismiss it because of course they will, but when the head of the HSE in the middle of summer is warning that our hospitals are close to collapse then it doesn't take a rocket surgeon to see what comes later.

    Indeed. And there was a story out of the UK a couple of days ago about a 5 year winter plan: https://www.chroniclelive.co.uk/news/uk-news/governments-winter-covid-plan-could-20951592


  • Posts: 220 [Deleted User]


    https://twitter.com/gavreilly/status/1411656173879693319

    Finally Reid tells the truth. Our hospitals are a joke.

    If the HSE is unable to cope with forty Covid cases, 16 months after it demanded a two-week ban on businesses and socialising which is now in its second year, to flatten the curve and allow the HSE to increase capacity, then it is difficult to see how its Director General - who has been paid €560,137 of taxpayers' money since demanding the lockdown - should remain in place.


  • Advertisement
  • Moderators, Entertainment Moderators, Society & Culture Moderators Posts: 14,115 Mod ✭✭✭✭pc7


    https://twitter.com/gavreilly/status/1411656173879693319

    Finally Reid tells the truth. Our hospitals are a joke.

    And when you think of all the money at hand the last year they did nothing to fix it, just plug holes in a sinking ship.


Advertisement